
 대표어
권호기사보기
| 기사명 | 저자명 | 페이지 | 원문 | 기사목차 |
|---|
결과 내 검색
동의어 포함
목차
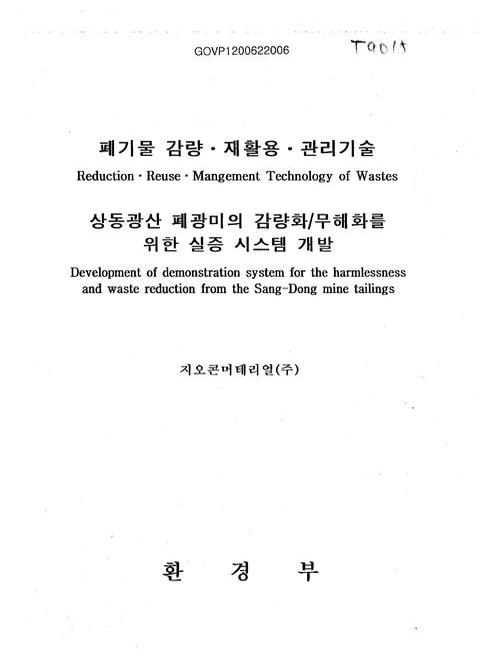
[표제지]=1,1,1
제출문=2,2,1
요약문=3,3,6
Summary=9,9,4
Contents=13,13,2
목차=15,15,2
List Of Table=17,17,2
List Of Figure=19,19,2
List Of Photo=21,21,2
제1장 서론=23,23,4
제1절 연구의 목적=27,27,1
제2절 연구의 범위 및 내용=28,28,1
제2장 국내ㆍ외 기술개발 현황=29,29,1
제1절 외국의 광산폐기물 처리 현황=29,29,11
제2절 국내 폐광미의 처리 현황=40,40,11
제3장 연구개발 수행 내용 및 결과=51,51,1
제1절 상동광산 폐광미의 특성=51,51,6
제2절 폐광미의 고도 선별처리 특성=57,57,2
1. 고도 선별 처리 기술의 개요=58,58,10
2. 실험 방법=68,68,2
3. 실험 결과 및 고찰=70,70,7
4. 고도 선별 처리 산물의 환경 위해성 평가=77,77,3
제3/4절 실증화 시스템 연구=80,80,4
1. 공정 수립=84,84,3
2. 실증화 시스템 설계 및 설치=87,87,20
3. 실증화 시스템 운전 및 시제품 제조=107,107,7
제4절 시제품의 적용 연구=114,114,1
1. 시제품을 활용한 시멘트 및 콘크리트 경화체의 특성=115,115,9
2. 시제품을 활용한 시멘트 및 콘크리트 혼화재의 특성=124,124,9
3. 시제품의 입자크기에 따른 혼화재의 특성=133,133,9
제5절 종합고찰=142,142,5
제4장 연구개발 목표달성도 및 대외기여도=147,147,1
제1절 연구개발 목표달성도=147,147,4
제2절 대외 기여도=151,151,4
제5장 연구개발 결과의 활용계획=155,155,4
제6장 참고문헌=159,159,8
Appendix=167,167,1
실증화 시스템 설계도=168,168,47
Fig. 2-1. Remediation Methods For The Polluted Soil=32,32,1
Fig. 2-2. Flow Diagram Of The Cyanisorp Process=36,36,1
Fig. 2-3. Mechanism Of Occurrence Of Mine Pollution=40,40,1
Fig. 2-4. Occurrence Mechanism Of The Polluted Water From A Mine Wastes=43,43,1
Fig. 2-5. Landfilling Method Of A Mine Tailing (Sheltering Method)=45,45,1
Fig. 3-1. XRD Patterns Of The Sang-Dong Mine Tailings=55,55,1
Fig. 3-2. Particle Size Distributions Of Sang-Dong Mine Tailing=56,56,1
Fig. 3-3. Principle Of The Classification=59,59,1
Fig. 3-4. Principle Of The Gravity Separation=62,62,1
Fig. 3-5. Principle Of The Magnetic Separation=63,63,1
Fig. 3-6. Principle Of The Electrostatic Separation=65,65,1
Fig. 3-7. Principle Of Flotation=66,66,1
Fig. 3-8. Block Diagram Of Lab. Test=69,69,1
Fig. 3-9. XRD Patterns Of The Metallic Minerals Separated In Gravity Separation Process=71,71,1
Fig. 3-10. XRD Patterns Of The Magnetic Minerals Separated In Magnetic Separation Process=73,73,1
Fig. 3-11. XRD Pattern Of The Fine Particle Minerals Separated In Air Classification Process=75,75,1
Fig. 3-12. Location Of Demonstration Plant=81,81,1
Fig. 3-13. Design Of Demonstration Plant=82,82,1
Fig. 3-14. Flow Diagram Of Demonstration Plant=86,86,1
Fig. 3-15. Lay-Out Of Demonstration Plant=88,88,1
Fig. 3-16. Particle Size Distribution Of Fine Particle Minerals=109,109,1
Fig. 3-17. XRD Patterns Of From Demonstration System On The Sang-Dong Mine Tailing=113,113,1
Fig. 3-18. X-ray Diffraction Patterns Of Cement Mortar Admixed With Fine Tailing=118,118,1
Fig. 3-19. Mass Change Of Cement Mortar Admixed With Fine Tailing=121,121,1
Fig. 3-20. Reduction Ratio Of Compressive Strength Of Cement Mortar Admixed With Fine Tailing=122,122,1
Fig. 3-21. Chloride Ion Penetration Depth Of Cement Mortars Immersed In 5% NaCl=123,123,1
Fig. 3-22. Flow Of Cement Mortar=128,128,1
Fig. 3-23. Compressive Strength Of The Cement Mortar Contained Mine Tailing=128,128,1
Fig. 3-24. Compressive Strength Of The Concrete Mortar Contained Mine Tailing=130,130,1
Fig. 3-25. XRD Patterns Of Hardening Body For Cement Mortar=131,131,1
Fig. 3-26. Compressive Strength Of Concrete Hardening Body According To Curing Days=139,139,1
Fig. 3-27. Compressive Strength Of 28 Days For Hardening Body Contained FT=140,140,1
Fig. 4-1. Schematic Diagram Of This Study=148,148,1
Photo. 3-1. Tailing Pond Dam Of Sang-Dong Mine Tailings=83,83,1
Photo. 3-2. Photograph Of Demonstration Plant=89,89,1
Photo. 3-3. Photograph Of Hopper=92,92,1
Photo. 3-4. Photograph Of Drying System=94,94,1
Photo. 3-5. Photograph Of Air Classifier=97,97,1
Photo. 3-6. Photograph Of Silo=98,98,1
Photo. 3-7. Photograph Of Magnetic Separator=101,101,1
Photo. 3-8. Photograph Of Jig Gravity Separator=104,104,1
Photo. 3-9. Photograph Of Bag Filter System=106,106,1
Photo. 3-10. SEM Images Of Cement Mortar Admixed With Fine Tailing (×1000)=119,119,1
Photo. 3-11. SEM Image Of Hardening Body For Cement Mortar (×1000)=132,132,1
Photo. 3-12. SEM Image Of Demonstrative Products (×500)=135,135,1
Photo. 3-13. SEM Image Of Hardening Body (×1000)=141,141,1
*표시는 필수 입력사항입니다.
| 전화번호 |
|---|
| 기사명 | 저자명 | 페이지 | 원문 | 기사목차 |
|---|
| 번호 | 발행일자 | 권호명 | 제본정보 | 자료실 | 원문 | 신청 페이지 |
|---|
도서위치안내: / 서가번호:

우편복사 목록담기를 완료하였습니다.
*표시는 필수 입력사항입니다.
저장 되었습니다.
