
 대표어
대표어

권호기사보기
| 기사명 | 저자명 | 페이지 | 원문 | 기사목차 |
|---|
결과 내 검색
동의어 포함
표제지
제출문
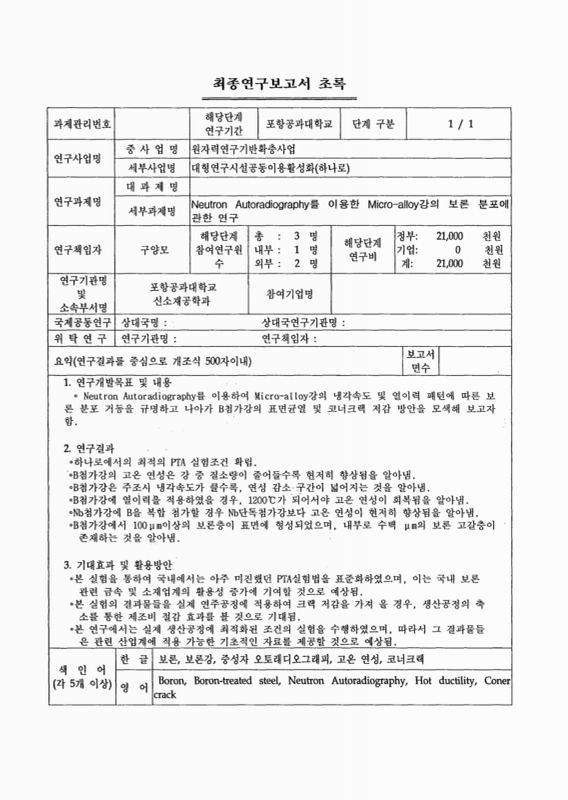
최종연구보고서 초록
요약문
SUMMARY
CONTENTS
목차
제1장. 연구개발과제의 개요 11
제2장. 국내외 기술개발 현황 13
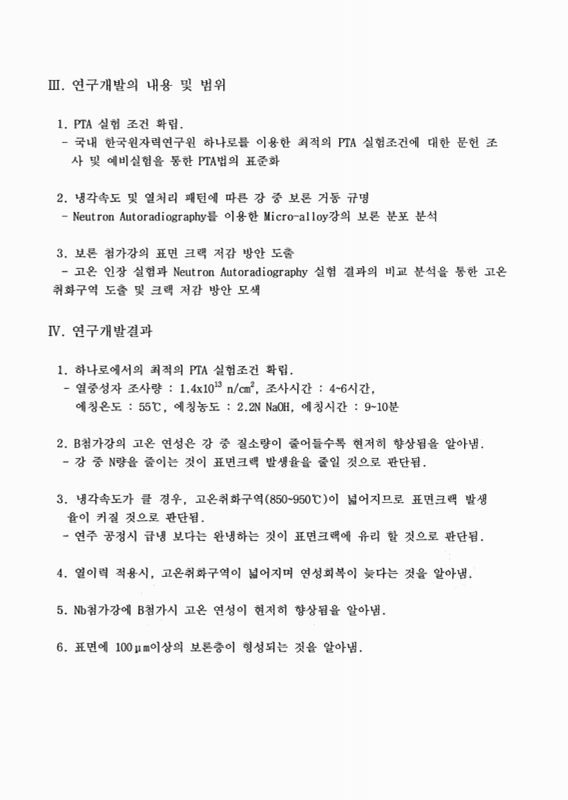
제3장. 연구개발 수행 내용 및 결과 18
제1절. 이론적배경 18
1. 보론의 결정립계 편석 18
2. PTA기법 21
제2절. PTA실험 22
1. 시료 준비 22
2. 열처리 조건 24
3. PTA실험방법 25
4. 실험결과 26
5. 결과분석 42
6. 결론 43
제4장. 연구개발 목표 달성도 및 관련 분야에의 기여도 44
제1절. 연구개발 목표 달성도 44
제2절. 관련분야에의 기여도 45
제5장. 연구개발결과의 활용계획 46
제6장. 연구개발과정에서 수집한 해외과학기술정보 47
제7장. 참고문헌 48
[별첨] 빔 이용시간(2007 - 하나로 ENF 이용)
Fig. 1. Lateral resolution[22] 16
Fig. 2. Schematic illustration of roles of equilibrium and non-equilibrium boron segregation.... 20
Fig. 3. 중성자 조사를 이용한보론 검출 원리 21
Fig. 4. Cutting of samples 22
Fig. 5. A sample preparation 23
Fig. 6. Aluminum holder 23
Fig. 7. The diagram for heat treatment 24
Fig. 8. The diagram for reheating treatment 24
Fig. 9. Experimental procedure of PTA technique 25
Fig. 10. Comparison OM(a) and PTA(b) 26
Fig. 11. Hot ductility curves for B0N100 with cooling rate 1℃/s and 20℃/s. 27
Fig. 12. Hot ductility curves for B25N100 with cooling rate 1℃/s and 20℃/s 27
Fig. 13. Hot ductility curves for B25N10 with cooling rate 1℃/s and 20℃/s 28
Fig. 14. Hot ductility curves for BON100 for reheating treatment. 29
Fig. 15. Hot ductility curves for B25N100 for reheating treatment. 29
Fig. 16. Hot ductility curves for Nb-B0N50 with cooling rate 1℃/s and 20℃/s. 30
Fig. 17. Hot ductility curves for Nb-B25N50 with cooling rate 1℃/s and 20℃/s 30
Fig. 18. The distribution of boron in B25N100 cooled from 1350℃, with cooling rate 20℃/s to (a) 800℃, (b) 850℃, (c) 900℃, (d) 950℃, (e) 1000℃ 31
Fig. 19. The distribution of boron in B25N100 cooled from 1350℃, with cooling rate 1℃/s to (a) 800℃, (b) 850℃, (c) 900℃, (d) 950℃, (e) 1000℃ 32
Fig. 20. The distribution of boron in B25N10 cooled from 1350℃, with cooling rate 20℃/s to (a) 800℃, (b) 850℃, (c) 900℃, (d) 950℃, (e) 1000℃ 33
Fig. 21. The distribution of boron in B25N10 cooled from 1350℃, with cooling rate 1℃/s to (a) 800℃, (b) 850℃, (c) 900℃, (d) 950℃, (e) 1000℃ 34
Fig. 22. The distribution of boron in B25N100 cooled from 1350℃, with cooling rate 20℃/s to T1(600℃) after holding for 60s at 600℃, reheating to T2{ (a) 800℃, (b) 900℃, (c) 1000℃, (d) 1100℃, (e) 1200℃ } 35
Fig. 23. The distribution of boron in B25N100 cooled from 1350℃, with cooling rate 20℃/s to T1(700℃) after holding for 60s at 700℃, reheating to T2{ (a) 800℃, (b) 1000℃, (c) 1100℃ } 36
Fig. 24. The distribution of boron in B25N100 cooled from 1350℃, with cooling rate 20℃/s to T1(800℃) after holding for 60s at 800℃, reheating to T2{ (a) 900℃, (b) 1000℃, (c) 1100℃ } 37
Fig. 25. The distribution of boron in B25N100 cooled from 1350℃, with cooling rate 20℃/s to T1(900℃) after holding for 60s at 900℃, reheating to T2{ (a) 1000℃, (b) 1100℃, (c) 1200℃ } 38
Fig. 26. The distribution of boron in Nb-B25N50 cooled from 1350℃, with cooling rate 20℃/s to (a) 850℃, (b) 900℃, (c) 950℃, (d) 1000℃ 39
Fig. 27. The distribution of boron in Nb-B25N50 cooled from 1350℃, with cooling rate 1℃/s to (a) 850℃, (b) 900℃, (c) 950℃, (d) 1000℃ 40
Fig. 28. The distribution of boron from surface in B25N100 cooled from 1350℃, with cooling rate (a) 1℃/s, (b)20℃/s to 800℃ 41
Fig. 29. The distribution of boron from surface in B25N10 cooled from 1350℃, with cooling rate (a) 1℃/s, (b)20℃/s to 800℃ 41
Fig. 30. PTA [29] 47
Fig. 31. SIMS [30] 47
Fig. 32. 3DAP [31] 47
| 등록번호 | 청구기호 | 권별정보 | 자료실 | 이용여부 |
|---|---|---|---|---|
| T000025646 | 전자형태로만 열람가능함 | 이용불가 |
*표시는 필수 입력사항입니다.
| 전화번호 |
|---|
| 기사명 | 저자명 | 페이지 | 원문 | 기사목차 |
|---|
| 번호 | 발행일자 | 권호명 | 제본정보 | 자료실 | 원문 | 신청 페이지 |
|---|
도서위치안내: / 서가번호:

우편복사 목록담기를 완료하였습니다.
*표시는 필수 입력사항입니다.
저장 되었습니다.
