
 대표어
권호기사보기
| 기사명 | 저자명 | 페이지 | 원문 | 기사목차 |
|---|
결과 내 검색
동의어 포함
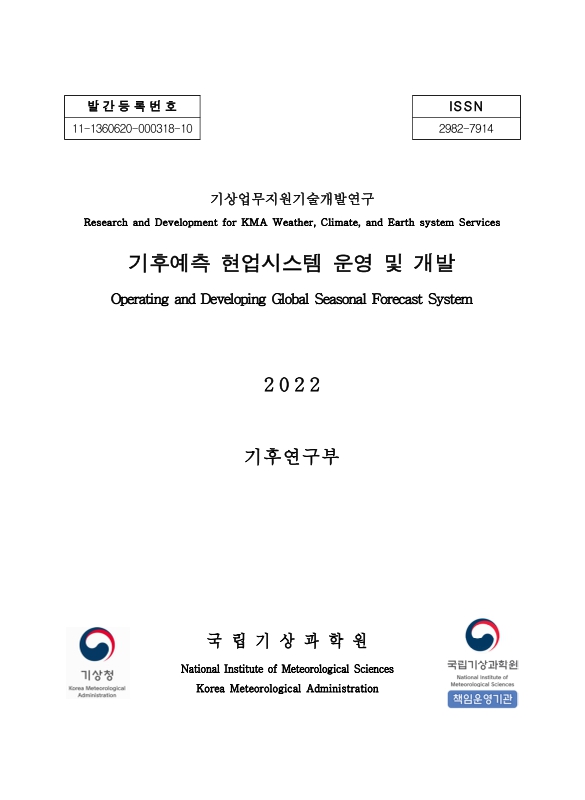
[표지] 1
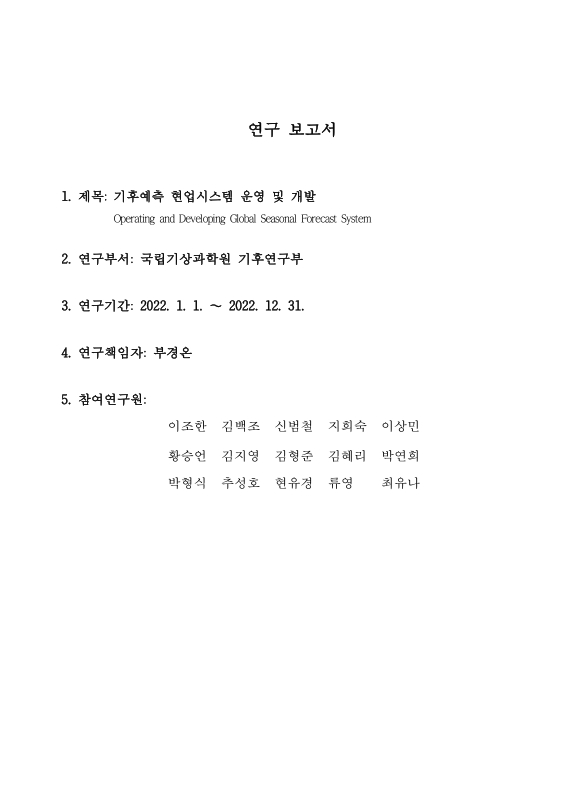
연구 보고서 2
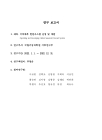
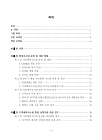
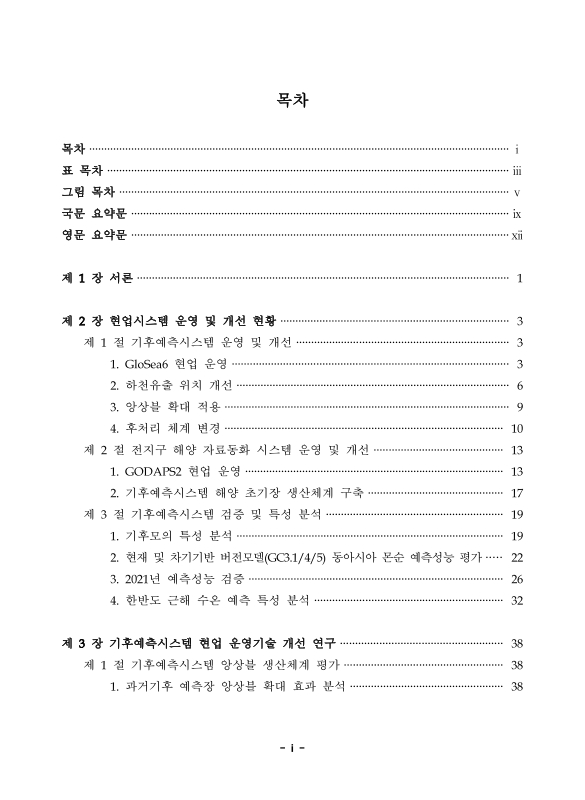
목차 3
요약문 11
Summary 14
제1장 서론 19
제2장 현업시스템 운영 및 개선 현황 21
제1절 기후예측시스템 운영 및 개선 21
1. GloSea6 현업 운영 21
2. 하천유출 위치 개선 24
3. 앙상블 확대 적용 27
4. 후처리 체계 변경 28
제2절 전지구 해양 자료동화 시스템 운영 및 개선 31
1. GODAPS2 현업 운영 31
2. 기후예측시스템 해양 초기장 생산체계 구축 35
제3절 기후예측시스템 검증 및 특성 분석 37
1. 기후모의 특성 분석 37
2. 현재 및 차기기반 버전모델(GC3.1/4/5) 동아시아 몬순 예측성능 평가 40
3. 2021년 예측성능 검증 44
4. 한반도 근해 수온 예측 특성 분석 50
제3장 기후예측시스템 현업 운영기술 개선 연구 56
제1절 기후예측시스템 앙상블 생산체계 평가 56
1. 과거기후 예측장 앙상블 확대 효과 분석 56
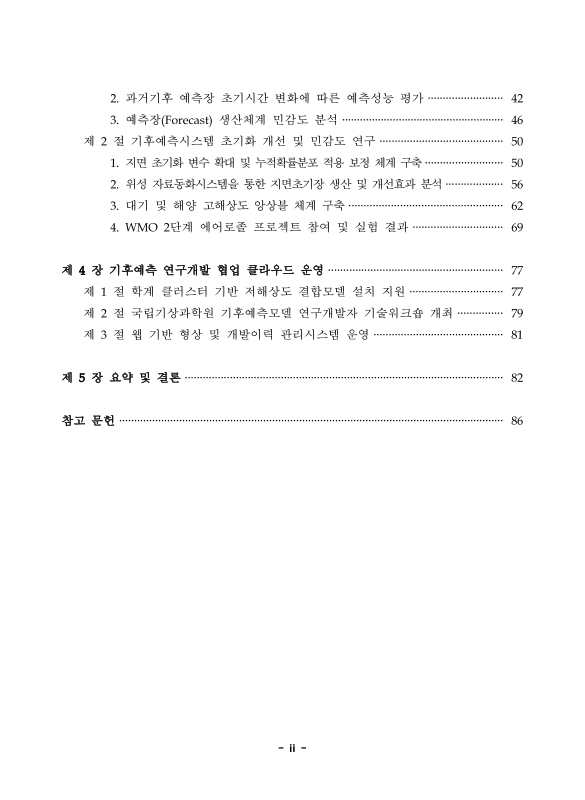
2. 과거기후 예측장 초기시간 변화에 따른 예측성능 평가 60
3. 예측장(Forecast) 생산체계 민감도 분석 64
제2절 기후예측시스템 초기화 개선 및 민감도 연구 68
1. 지면 초기화 변수 확대 및 누적확률분포 적용 보정 체계 구축 68
2. 위성 자료동화시스템을 통한 지면초기장 생산 및 개선 효과 분석 74
3. 대기 및 해양 고해상도 앙상블 체계 구축 80
4. WMO 2단계 에어로졸 프로젝트 참여 및 실험 결과 87
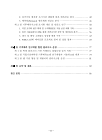
제4장 기후예측 연구개발 협업 클라우드 운영 95
제1절 학계 클러스터 기반 저해상도 결합모델 설치 지원 95
제2절 국립기상과학원 기후예측모델 연구개발자 기술워크숍 개최 97
제3절 웹 기반 형상 및 개발이력 관리시스템 운영 99
제5장 요약 및 결론 100
참고 문헌 104
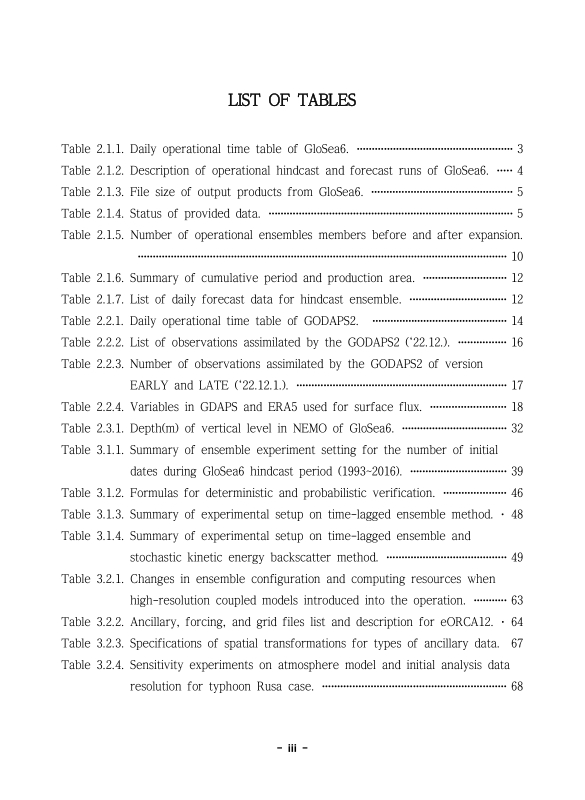
Fig. 2.1.1. Distribution of sea surface salinity before(top) and after... 24
Fig. 2.1.2. The difference between sea surface salinity before and afte... 24
Fig. 2.1.3. Timeseries of hindcast ensemble members before and after river... 25
Fig. 2.1.4. Signal to noise ratio distribution before(left) and after(right) river... 25
Fig. 2.1.5. Bias distribution before(left) and after(right) river mouth adjustment... 26
Fig. 2.1.6. [그림없음] 7
Fig. 2.1.7. Graphic of 1.5m temperature CDF at (a)1-6 weeks and (b) 1-2... 30
Fig. 2.2.1. Schematic diagram of the GODAPS2 31
Fig. 2.2.2. Schematic diagram of observations collection 33
Fig. 2.3.1. Spatial biases for 500 hPa geopotential height (a) during summer... 38
Fig. 2.3.2. Same as Fig. 2.3.1 except but SST during (a) JJA and (b) DJF 39
Fig. 2.3.3. Differences of absolute biases between GloSea6 and 5(bias... 40
Fig. 2.3.4. Normalized GC models(symbols) and the observation spread... 41
Fig. 2.3.5. Time-Latitude plot of pentad(5-day) mean rainfall... 42
Fig. 2.3.6. Map of correlation coefficients for JJA mean WNPMI-Prcp, DJF... 43
Fig. 2.3.7. Spatial distribution of the 500hPa geopotential height bias 47
Fig. 2.3.8. Same as in Fig. 2.3.7, but for RMSE 47
Fig. 2.3.9. Same as in Fig. 2.3.7, but for ACC 48
Fig. 2.3.10. Same as in Fig. 2.3.7, but for MSSS 48
Fig. 2.3.11. Same as in Fig. 2.3.7, but for seasonal bias 49
Fig. 2.3.12. (a) z-coordinate in linear free-surface case... 50
Fig. 2.3.13. The depth of 75 levels in NEMO of GloSea6 and offshore on... 51
Fig. 2.3.14. Timeseries of forecast & hindcast in sea water... 52
Fig. 2.3.15. The monthly climatological... 53
Fig. 2.3.16. The vertical climatological distribution(00, 25, 50m) of sea water... 53
Fig. 2.3.17. The comparison of vertical distribution in forecast sea water... 54
Fig. 2.3.18. The depth-latitude distribution of 6-day forecast in Climate Forecast... 55
Fig. 3.1.1. Differences of correlation coefficients between 7 ensemble members... 58
Fig. 3.1.2. The 1.5 m temperature reliability map of (a) 7 members and (b) 3... 60
Fig. 3.1.3. Difference of correlation coefficients and normalized bias for... 62
Fig. 3.1.4. Differences of absolute bias between 7 ensemble members and 3... 63
Fig. 3.1.5. RMSE by number of initial dates for 1-8 weeks lead time 65
Fig. 3.1.6. (a) BS, RPS and AUC results and (b) RPS and AUC improvement... 67
Fig. 3.1.7. RMSE of operation system and experiment 67
Fig. 3.2.1. Differences of initial soil temperature between EXP and CTL in 4... 71
Fig. 3.2.2. (a) Difference between EXP and CTL and (b) difference between... 72
Fig. 3.2.3. The same as Fig. 3.1.2 but for Winter of 2021 - 2022 73
Fig. 3.2.4. Schematic diagram of the land-initialization process in (a) current... 75
Fig. 3.2.5. Schematic figure of ensemble configuration of operational GloSea6... 75
Fig. 3.2.6. The probability distribution function of surface soil moisture content... 76
Fig. 3.2.7. (a) Analysis increment(analysis - background) and (b) different ratio... 77
Fig. 3.2.8. The initial soil moisture content of (a) background, (b) CTL, (c) the... 78
Fig. 3.2.9. Difference between the 1.5 m air temperatures of GloSea6 summer 2020 forecasts... 79
Fig. 3.2.10. Difference(NEW-CTL) of RMSEs of GloSea6 summer 2020 forecasts initiated at late... 79
Fig. 3.2.11. User interface(left) and procedure(right) to generate remap... 83
Fig. 3.2.12. User interface(left) and procedure(right) for spatial... 84
Fig. 3.2.13. Sample plots of spatial transformation result from eORCA025(left)... 84
Fig. 3.2.14. Typhoon track and central pressure of observation and each... 86
Fig. 4.1.1. A schematic illustrating the role of different parts of the... 95
Fig. 4.1.2. A schematic illustrating the S2S or weather-climate... 96
| 등록번호 | 청구기호 | 권별정보 | 자료실 | 이용여부 |
|---|---|---|---|---|
| 0003004277 | 551.6 -23-21 | v.1 | 서울관 서고(열람신청 후 1층 대출대) | 이용가능 |
| 0003004278 | 551.6 -23-21 | v.1 | 서울관 서고(열람신청 후 1층 대출대) | 이용가능 |
*표시는 필수 입력사항입니다.
| 전화번호 |
|---|
| 기사명 | 저자명 | 페이지 | 원문 | 기사목차 |
|---|
| 번호 | 발행일자 | 권호명 | 제본정보 | 자료실 | 원문 | 신청 페이지 |
|---|
도서위치안내: / 서가번호:

우편복사 목록담기를 완료하였습니다.
*표시는 필수 입력사항입니다.
저장 되었습니다.
