
 대표어
대표어
 https://ecolibrary.me.go.kr/nier/#/search/detail/5914513?offset=1


권호기사보기
| 기사명 | 저자명 | 페이지 | 원문 | 기사목차 |
|---|
결과 내 검색
동의어 포함
표제지
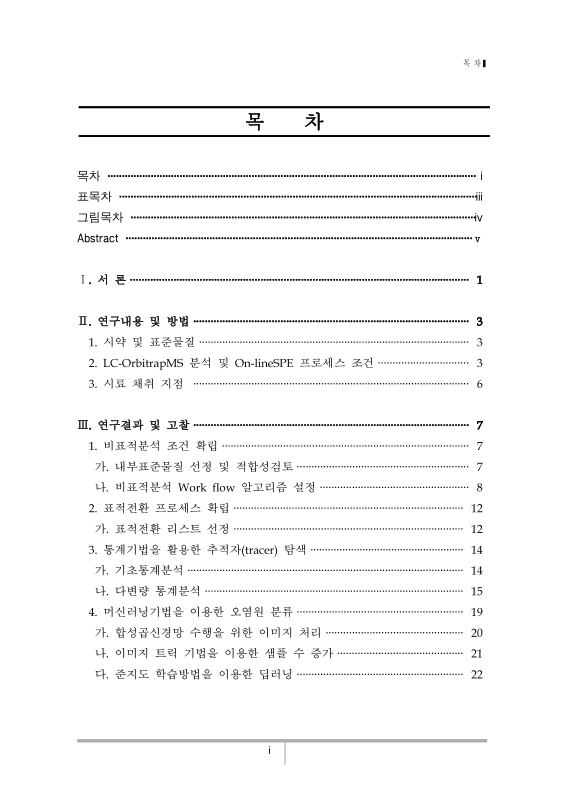
목차
Abstract 6
Ⅰ. 서론 8
Ⅱ. 연구내용 및 방법 10
1. 시약 및 표준물질 10
2. LC-OrbitrapMS 분석 및 On-lineSPE 프로세스 조건 10
3. 시료 채취 지점 13
Ⅲ. 연구결과 및 고찰 14
1. 비표적분석 조건 확립 14
가. 내부표준물질 선정 및 적합성검토 14
나. 비표적분석 Work flow 알고리즘 설정 15
2. 표적전환 프로세스 확립 19
가. 표적전환 리스트 선정 19
3. 통계기법을 활용한 추적자(tracer) 탐색 21
가. 기초통계분석 21
나. 다변량 통계 분석 22
4. 머신러닝기법을 이용한 오염원 분류 26
가. 합성곱신경망 수행을 위한 이미지 처리 27
나. 이미지 트릭 기법을 이용한 샘플 수 증가 28
다. 준지도 학습방법을 이용한 딥러닝 29
Ⅳ. 결론 31
참고문헌 33
〈Figure 1〉 Instrumental process conditions of On-lineSPE 11
〈Figure 2〉 Instrumental conditions of HPLC and On-lineSPE 11
〈Figure 3〉 Schematic map of sampling site 13
〈Figure 4〉 Internal standard area of sample 15
〈Figure 5〉 Venn diagram(a) and UpSet plot(b) of non-target feature numbers 22
〈Figure 6〉 Score plots of PLS-DA(a) and VIP scores(b) 23
〈Figure 7〉 Score plots of sPLS-DA(a) and loading plots (b-c) 25
〈Figure 8〉 Heatmap of non-target profile feature numbers 26
〈Figure 9〉 Conceptual illustration of transposing an image matrix 29
〈Figure 10〉 t-SAN plot of 24,000 mass spectra image through transpose 30
*표시는 필수 입력사항입니다.
| 전화번호 |
|---|
| 기사명 | 저자명 | 페이지 | 원문 | 기사목차 |
|---|
| 번호 | 발행일자 | 권호명 | 제본정보 | 자료실 | 원문 | 신청 페이지 |
|---|
도서위치안내: / 서가번호:

우편복사 목록담기를 완료하였습니다.
*표시는 필수 입력사항입니다.
저장 되었습니다.
