
 대표어
대표어
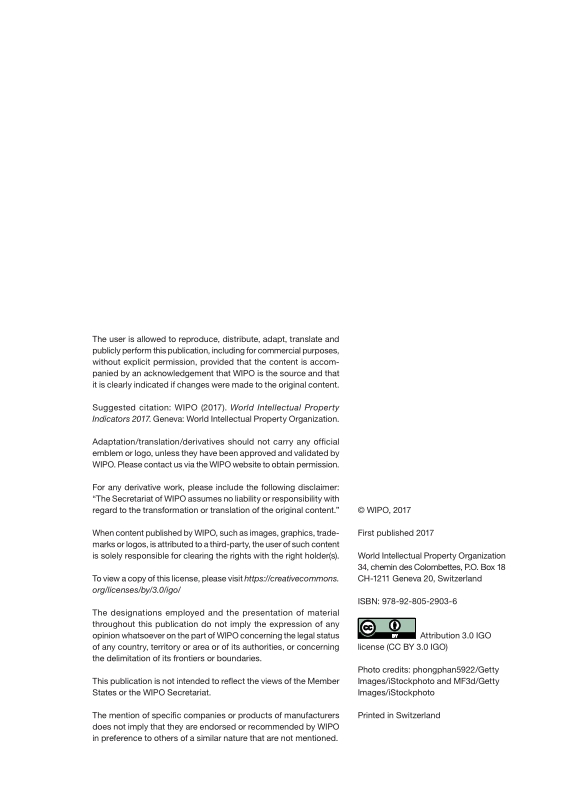
 http://www.wipo.int/publications/en/details.jsp?id=4234&plang=EN


권호기사보기
| 기사명 | 저자명 | 페이지 | 원문 | 기사목차 |
|---|
결과 내 검색
동의어 포함
Title page
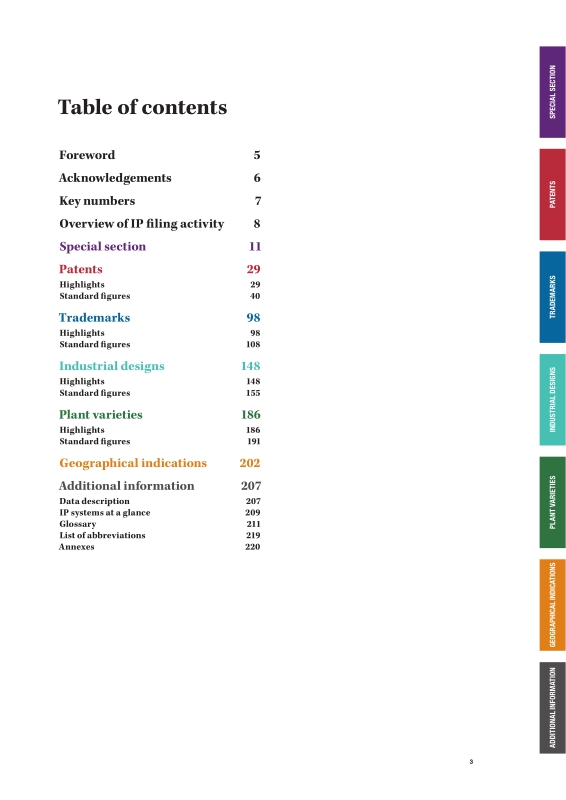
Contents
Foreword 6
Acknowledgements 7
Key numbers 8
Overview of IP filing activity 9
Special section 12
Patents 30
Highlights 30
Standard figures and tables 41
Trademarks 99
Highlights 99
Standard figures and tables 109
Industrial designs 149
Highlights 149
Standard figures and tables 156
Plant varieties 187
Highlights 187
Standard figures and tables 192
Geographical indications 203
Additional information 208
Data description 208
IP systems at a glance 210
Glossary 212
List of abbreviations 220
Annex A. IPC-technology concordance table 221
Annex B. Definitions for selected energy-related technology fields 222
Annex C. International Classification of Goods and Services under the Nice Agreement 223
Annex D. International Classification for Industrial Designs (Locarno Classification) 224
Notes 225
Special section 13
Figure S1. Evolution of the number of patent applications filed at selected offices 13
Figure S2. Evolution of potentially pending applications 14
Figure S3. Trends in the number of patent applications filed and the number of patent examiners for selected offices 15
Figure S4. Average number of filings per examiner for selected patent offices 18
Figure S5. Average pendency times for first office action and final decision at selected offices, 2016 20
Figure S6. Average pendency times for first office action and final decision at selected offices, 2011 and 2016 21
Figure S7. Distribution of patent examination outcomes for selected offices, 2016 22
Figure S8. Distribution of patent examination outcomes for selected offices 23
Patents 30
Figure 1. Patent applications worldwide 30
Figure 2. Patent applications at the top 10 offices, 2016 31
Figure 3. Patent applications by region 32
Figure 4. Patent applications by income group 33
Figure 5. Patent applications and patent families worldwide 35
Figure 6. Resident patent applications per USD 100 billion GDP for the top 10 origins 37
Figure 7. Patent grants worldwide 38
Trademarks 99
Figure 8. Trademark applications worldwide 99
Figure 9. Trademark application class counts worldwide 99
Figure 10. Trademark application class counts for the top 10 offices, 2016 101
Figure 11. Trademark application class counts by income group 102
Figure 12. Trademark application class counts by region 102
Figure 13. Share of total non-resident filing activity by origin at selected offices 105
Figure 14. Resident trademark application class count per USD 100 billion GDP for selected origins 106
Industrial designs 149
Figure 15. Industrial design applications worldwide 149
Figure 16. Number of designs in industrial design applications worldwide 149
Figure 17. Application design counts for the top 10 offices, 2016 150
Figure 18. Application design counts by income group 151
Figure 19. Application design counts by region 151
Figure 20. Resident application design counts per USD 100 billion GDP for the top 10 origins 154
Plant varieties 187
Figure 21. Plant variety applications worldwide 187
Figure 22. Plant variety applications for the top 10 offices, 2016 188
Figure 23. Plant variety applications by income group 188
Figure 24. Plant variety applications by region 189
Figure 25. Plant variety titles issued worldwide 191
Geographical indications 205
Figure 26. Geographical indications in force worldwide, 2016 205
Figure 27. Geographical indications in force by national/regional authority, 2016 205
Figure 28. Appellations of origin in force by origin, 2016 206
Figure 29. Geographical indications in force in 2016 207
Maps
Map 1. Equivalent patent applications by origin, 2016 34
Map 2. Equivalent trademark application class counts by origin, 2016 103
Map 3. Equivalent design counts by origin, 2016 153
Map 4. Equivalent plant variety applications by origin, 2016 190
Standard figures and tables
Figure A1. Trend in patent applications worldwide 44
Figure A2. Resident and non-resident patent applications worldwide 44
Figure A3. Trend in patent grants worldwide 45
Figure A4. Resident and non-resident patent grants worldwide 45
Figure A5. Patent applications by income group 46
Figure A6. Patent applications by region 46
Figure A7. Trend in patent applications for the top five offices 47
Figure A8. Patent applications at the top 20 offices, 2016 47
Figure A9. Contribution of resident and non-resident applications to total growth for the top 20 offices, 2015-16 48
Figure A10. Patent applications at offices of selected low- and middle-income countries, 2016 48
Figure A11. Contribution of resident and non-resident applications to total growth for offices of selected low- and middle-income countries, 2015-16 49
Figure A12. Patent grants by income group 49
Figure A13. Patent grants by region 50
Figure A14. Trend in patent grants for the top five offices 50
Figure A15. Patent grants for the top 20 offices, 2016 51
Figure A16. Patent grants for offices of selected low- and middle-income countries, 2016 51
Figure A17. Equivalent patent applications by origin, 2016 52
Figure A18. Equivalent patent applications for the top 20 origins, 2016 52
Figure A19. Patent applications for the top 25 offices and origins, 2016 53
Figure A20. Flow of non-resident patent applications between the top five origins and the top 10 offices, 2016 55
Figure A21. Distribution of patent applications for the top 15 offices and selected origins, 2016 56
Figure A22. Equivalent patent grants for the top 20 origins, 2016 56
Figure A23. Trend in patent families worldwide 57
Figure A24. Trend in foreign-oriented patent families worldwide 57
Figure A25. Domestic and foreign-oriented patent families for the top 20 origins, 2012-14 58
Figure A26. Distribution of patent families by number of offices for the top 20 origins, 2012-14 58
Figure A27. Top 100 patent applicants worldwide, based on total number of patent families 59
Figure A28. Distribution of technology fields for each top 10 applicant based on patent families, 2011-14 61
Figure A29. Trend in university and PRO patent families worldwide 62
Figure A30. Top five university and PRO patent applicants worldwide for selected origins, based on patent families 63
Figure A31. Distribution of technology fields for selected universities and PROs based on patent families, 2011-14 64
Figure A32. Published patent applications worldwide by field of technology 65
Figure A33. Trend in published patent applications for the top five technology fields 66
Figure A34. Distribution of published patent applications by technology field for the top 10 origins, 2013-15 67
Figure A35. Trend in patent applications in energy-related technologies 68
Figure A36. Women inventors in PCT applications 69
Figure A37. Share of PCT applications with women inventors for the top 20 origins, 2016 69
Figure A38. Share of PCT international patent applications with women inventors by field of technology, 2016 70
Figure A39. Share of patent applications with women inventors for selected patent offices 70
Figure A40. Share of patent applications with women inventors for selected patent offices by field of technology, 2014 71
Figure A41. Resident patent applications per USD 100 billion GDP for the top 20 origins 72
Figure A42. Resident patent applications per million population for the top 20 origins 72
Figure A43. Trend in patents in force worldwide 73
Figure A44. Patents in force at the top 20 offices, 2016 73
Figure A45. Patents in force in 2016 as a percentage of total applications 74
Figure A46. Average age of patents in force at selected offices 74
Figure A47. Potentially pending applications at the top offices 75
Figure A48. Potentially pending applications at the top 20 offices, 2016 75
Figure A49. Distribution of patent examination decisions for selected offices, 2016 76
Figure A50. Average pendency time for first office action for selected offices, 2016 76
Figure A51. Average years of experience of patent examiners for selected offices, 2016 77
Figure A52. Trend in PCT applications 78
Figure A53. PCT applications by origin, 2016 78
Figure A54. PCT applications for the top 20 origins, 2016 79
Figure A55. Trend in non-resident applications by filing route 79
Figure A56. Non-resident applications by filing route for selected offices, 2016 80
Figure A57. PPH requests by office of first filing and offices of later examination, 2016 81
Figure A58. Flow of PPH requests between offices of first filing and offices of later examination, 2016 82
Figure A59. Trend in utility model applications worldwide 83
Figure A60. Utility model applications for the top 20 offices, 2016 83
Figure A61. Utility model applications for offices of selected low-and middle-income countries, 2016 84
Figure A62. Trend in microorganism deposits worldwide 85
Figure A63. Deposits at the top international depositary authorities, 2016 85
Figure A64. Patent applications by office and origin, 2016 86
Figure A65. Patent grants by office and origin, and patents in force, 2016 91
Figure A66. Utility model applications and grants by office and origin, 2016 96
Figure B1. Trend in trademark applications worldwide 111
Figure B2. Trend in trademark application class counts worldwide 111
Figure B3. Resident and non-resident trademark application class counts worldwide 112
Figure B4. Trend in trademark registrations worldwide 112
Figure B5. Trend in trademark registration class counts worldwide 113
Figure B6. Resident and non-resident trademark registration class counts worldwide 113
Figure B7. Trademark application class counts by income group 114
Figure B8. Trademark application class counts by region 114
Figure B9. Trend in trademark applications for the top five offices 115
Figure B10. Trademark application class counts for the top 20 offices, 2016 115
Figure B11. Contribution of resident and non-resident application class counts to total growth for the top 20 offices, 2015-16 116
Figure B12. Trademark application class counts for offices of selected low- and middle-income countries, 2016 116
Figure B13. Contribution of resident and non-resident application class counts to total growth for offices of selected low- and middle-income countries, 2015-16 117
Figure B14. Trademark registration class counts by income group 117
Figure B15. Trademark registration class counts by region 118
Figure B16. Trend in trademark registrations for the top five offices 118
Figure B17. Trademark registration class counts for the top 20 offices, 2016 119
Figure B18. Trademark registration class counts for offices of selected low- and middle-income countries, 2016 119
Figure B19. Equivalent trademark application class counts by origin, 2016 120
Figure B20. Trademark application class counts for the top 20 origins, 2016 120
Figure B21. Trademark application class counts for selected low- and middle-income origins, 2016 121
Figure B22. Trademark application class counts abroad for the top 20 origins, 2016 121
Figure B23. Trademark application class counts for the top 25 offices and origins, 2016 122
Figure B24. Flow of non-resident trademark application class counts between selected top origins and offices, 2016 124
Figure B25. Distribution of trademark application class counts for the top 15 offices and selected non-resident origins, 2016 125
Figure B26. Distribution of trademark applications by top Nice classes, 2016 126
Figure B27. Trademark applications by goods and services classes, 2016 126
Figure B28. Trademark applications by industry sector, 2016 127
Figure B29. Trademark applications by top three sectors at the top offices, 2016 128
Figure B30. Distribution of trademark applications by goods and services at the top offices, 2016 128
Figure B31. Trademark applications by top three sectors for the top origins, 2016 129
Figure B32. Distribution of trademark applications by goods and services for the top origins, 2016 129
Figure B33. Resident trademark application class count per USD 100 billion GDP for selected origins 130
Figure B34. Resident trademark application class count per million population for selected origins 130
Figure B35. Collective trademark applications for the top 20 offices, 2016 131
Figure B36. Certification trademark applications for the top 20 offices, 2016 131
Figure B37. Trend in trademark registrations in force worldwide 132
Figure B38. Trademark registrations in force at selected offices, 2016 132
Figure B39. Trademark registrations in force in 2016 as a percentage of total registrations 133
Figure B40. Average age of trademarks in force at selected offices 133
Figure B41. Average number of days between the filing of an application and its recording as a registration for selected offices, 2016 134
Figure B42. Trend in Madrid international applications 135
Figure B43. Madrid international applications by origin, 2016 135
Figure B44. Madrid applications for the top 20 origins, 2016 136
Figure B45. Trend in non-resident filing activity by filing route (direct and Madrid) 136
Figure B46. Madrid share of non-resident filing activity for selected designated Madrid members, 2016 137
Figure B47. Trademark applications by office and origin, 2016 138
Figure B48. Trademark registrations by office and origin, and trademarks in force, 2016 143
Figure C1. Trend in industrial design applications worldwide 158
Figure C2. Trend in application design counts worldwide 158
Figure C3. Resident and non-resident application design counts worldwide 159
Figure C4. Trend in industrial design registrations worldwide 159
Figure C5. Trend in registration design counts worldwide 160
Figure C6. Resident and non-resident registration design counts worldwide 160
Figure C7. Application design counts by income group 161
Figure C8. Application design counts by region 161
Figure C9. Trend in industrial design applications for the top five offices 162
Figure C10. Application design counts for the top 20 offices, 2016 162
Figure C11. Contribution of resident and non-resident application design counts to total growth for the top 20 offices, 2015-16 163
Figure C12. Application design counts for offices of selected low- and middle-income countries, 2016 163
Figure C13. Contribution of resident and non-resident application design counts to total growth for offices of selected low- and middle-income countries, 2015-16 164
Figure C14. Registration design counts for the top 20 offices, 2016 164
Figure C15. Registration design counts for offices of selected low- and middle-income countries, 2016 165
Figure C16. Equivalent application design counts by origin, 2016 166
Figure C17. Application design counts for the top 20 origins, 2016 166
Figure C18. Equivalent application design counts for the top 20 origins, 2016 167
Figure C19. Application design counts for selected low- and middle-income origins, 2016 167
Figure C20. Flow of non-resident design counts for the top five origins and the top 10 offices of high-income economies, 2016 168
Figure C21. Flow of non-resident design counts for the top five origins and the top 10 offices of low- and middle-income economies, 2016 169
Figure C22. Application design counts by Locarno class, 2016 170
Figure C23. Distribution of application design counts by the top three sectors and for the top 10 offices, 2016 170
Figure C24. Distribution of application design counts by the top three sectors for the top 15 origins, 2016 171
Figure C25. Resident application design count per USD 100 billion of GDP for the top 20 origins 172
Figure C26. Resident application design count per million population for the top 20 origins 172
Figure C27. Trend in industrial design registrations in force worldwide 173
Figure C28. Industrial design registrations in force for the top 20 offices, 2016 173
Figure C29. Industrial design registrations in force in 2016 as a percentage of total registrations 174
Figure C30. Average age of industrial design registrations in force at selected offices 174
Figure C31. Designs contained in Hague international applications by origin, 2016 175
Figure C32. Trend in designs contained in Hague international applications 175
Figure C33. Designs contained in designations in Hague international applications for the top 20 designated Hague members, 2016 176
Figure C34. Designs contained in Hague international applications for the top 20 origins, 2016 176
Figure C35. Trend and share of designs contained in non-resident applications by filing route 177
Figure C36. Designs contained in non-resident applications by filing route for selected Hague members, 2016 177
Figure C37. Industrial design applications by office and origin, 2016 178
Figure C38. Industrial design registrations by office and origin, and industrial designs in force, 2016 182
Figure D1. Trend in plant variety applications worldwide 193
Figure D2. Trend in plant variety titles issued worldwide 193
Figure D3. Plant variety applications by income group 194
Figure D4. Plant variety applications by region 194
Figure D5. Plant variety applications for the top 20 offices, 2016 195
Figure D6. Contribution of resident and non-resident applications to total growth for the top 20 offices, 2015-16 195
Figure D7. Plant variety applications for offices of selected low- and middle-income countries, 2016 196
Figure D8. Plant variety titles issued by the top 20 offices, 2016 196
Figure D9. Equivalent plant variety applications by origin, 2016 197
Figure D10. Plant variety applications for the top 20 origins, 2016 197
Figure D11. Plant variety applications abroad for the top 20 origins, 2016 198
Figure D12. Plant variety titles issued for the top 20 origins, 2016 198
Figure D13. Plant variety titles issued abroad for the top 20 origins, 2016 199
Figure D14. Trend in plant varieties in force worldwide 200
Figure D15. Plant varieties in force at selected offices, 2016 200
Figure D16. Plant variety applications and titles issued by office and origin, 2016 201

An authoritative annual survey of IP activity around the globe. As well as filing, registration and maintenance of patents, utility models, trademarks, industrial designs, microorganisms and plant variety protection, the 2017 edition also covers geographical indications for the first time, making it even more comprehensive. A special section on the operational performance of patent offices takes an in-depth look at application processing times, examination capacity and examination outcomes.
*표시는 필수 입력사항입니다.
| 전화번호 |
|---|
| 기사명 | 저자명 | 페이지 | 원문 | 기사목차 |
|---|
| 번호 | 발행일자 | 권호명 | 제본정보 | 자료실 | 원문 | 신청 페이지 |
|---|
도서위치안내: / 서가번호:

우편복사 목록담기를 완료하였습니다.
*표시는 필수 입력사항입니다.
저장 되었습니다.
