
 대표어
대표어
 https://www.wipo.int/publications/en/details.jsp?id=4369&plang=EN


권호기사보기
| 기사명 | 저자명 | 페이지 | 원문 | 기사목차 |
|---|
결과 내 검색
동의어 포함
Title page
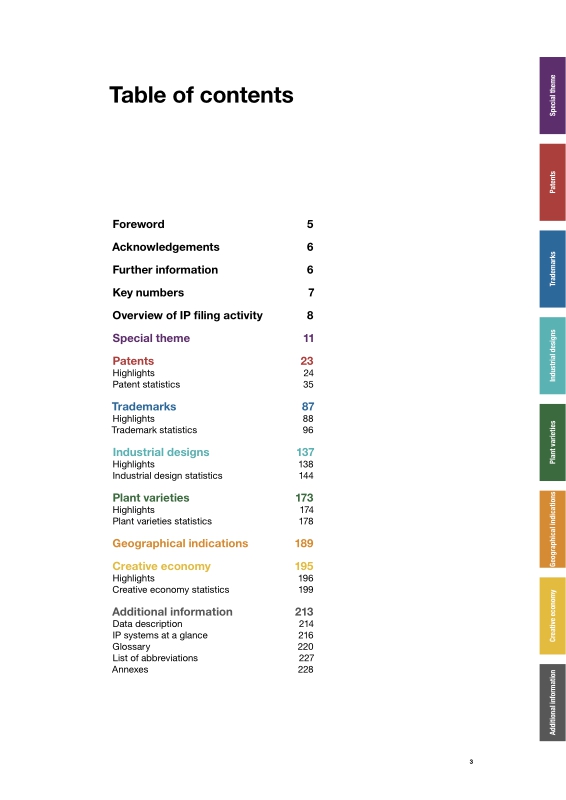
Contents
Foreword 6
Acknowledgements 7
Further information 7
Key numbers 8
Overview of IP filing activity 9
Special theme 12
Patents 24
Highlights 25
Patent statistics 36
Trademarks 88
Highlights 89
Trademark statistics 97
Industrial designs 138
Highlights 139
Industrial design statistics 145
Plant varieties 173
Highlights 174
Plant varieties statistics 178
Geographical indications 189
Creative economy 194
Highlights 195
Creative economy statistics 198
Additional information 211
Data description 212
IP systems at a glance 214
Glossary 218
Abbreviations 225
Annex A. Definitions for selected energy-related technology fields 226
Annex B. Composition of industry sectors by Nice goods and services classes 226
Annex C. Industry sectors by Locarno classes 226
Standard figures and tables
A1. Trend in patent applications worldwide, 2003-2017 38
A2. Resident and non-resident patent applications worldwide, 2003-2017 38
A3. Trend in patent grants worldwide, 2003-2017 39
A4. Resident and non-resident patent grants worldwide, 2003-2017 39
A5. Patent applications by income group, 2007 and 2017 40
A6. Patent applications by region, 2007 and 2017 40
A7. Trend in patent applications for the top five offices, 1883-2017 41
A8. Patent applications at the top 20 offices, 2017 41
A9. Contribution of resident and non-resident applications to total growth for the top 20 offices, 2016-2017 42
A10. Patent applications at offices of selected low- and middle-income countries, 2017 42
A11. Contribution of resident and non-resident applications to total growth for offices of selected low- and middle-income countries, 2016-2017 43
A12. Patent grants by income group, 2007 and 2017 43
A13. Patent grants by region, 2007 and 2017 44
A14. Trend in patent grants for the top five offices, 1883-2017 44
A15. Patent grants for the top 20 offices, 2017 45
A16. Patent grants for offices of selected low- and middle-income countries, 2017 45
A17. Equivalent patent applications by origin, 2017 46
A18. Equivalent patent applications for the top 20 origins, 2017 46
A19. Patent applications for the top 20 offices and origins, 2017 47
A20. Flows of non-resident patent applications between the top five origins and the top 10 offices, 2017 48
A21. Distribution of patent applications for the top 15 offices and selected origins, 2017 49
A22. Equivalent patent grants for the top 20 origins, 2017 49
A23. Trend in patent families worldwide, 2001-2015 50
A24. Distribution of patent families by number of offices for the top 20 origins, 2013-2015 50
A25. Trend in foreign-oriented patent families worldwide, 2000-2014 51
A26. Foreign-oriented patent families for the top 20 origins, 2013-2014 51
A27. Top 50 patent applicants worldwide, based on total number of patent families, 2013-2015 52
A28. Distribution of technology fields for each top 10 applicant based on patent families, 2013-2015 53
A29. Top five university and PRO patent applicants worldwide for selected origins, based on patent families, 2013-2015 54
A30. Distribution of technology fields for selected universities and PROs based on patent families, 2013-2015 55
A31. Published patent applications worldwide by field of technology, 2006, 2011 and 2016 56
A32. Distribution of published patent applications by technology field for the top 10 origins, 2014-2016 57
A33. Trend in patent applications in energy-related technologies, 2002-2016 58
A34. Relative specialization for patent applications in energy-related technologies for the top origins, 2014-2016 59
A35. PCT applications with women inventors, 2003-2017 60
A36. Share of PCT applications with women inventors for the top 20 origins, 2017 60
A37. Distribution of inventors listed in PCT applications for the top 20 origins, 2017 61
A38. Share of PCT patent applications with women inventors by field of technology, 2017 61
A39. Resident patent applications per USD 100 billion GDP for the top 20 origins, 2007 and 2017 62
A40. Resident patent applications per million population for the top 20 origins, 2007 and 2017 62
A41. Trend in patents in force worldwide, 2008-2017 63
A42. Patents in force at the top 20 offices, 2017 63
A43. Patents in force in 2017 as a percentage of total applications 64
A44. Average age of patents in force at selected offices, 2012 and 2017 64
A45. Distribution of patent examination outcomes for selected offices, 2017 65
A46. Potentially pending applications at the top 20 offices, 2017 65
A47. Average pendency times for first office action and final decision at selected offices, 2017 66
A48. Average years of experience of patent examiners for selected offices, 2017 66
A49. Trend in PCT applications, 2002-2017 67
A50. PCT applications by origin, 2017 67
A51. PCT applications for the top 20 origins, 2017 68
A52. PPH requests by offices of first filing and offices of later examination, 2017 69
A53. Flows of PPH requests between offices of first filing and offices of later examination, 2017 70
A54. Trend in utility model applications worldwide, 2003-2017 71
A55. Utility model applications for the top 20 offices, 2017 71
A56. Utility model applications for offices of selected low- and middle-income countries, 2017 72
A57. Trend in microorganism deposits worldwide, 2003-2017 73
A58. Deposits at the top international depositary authorities, 2017 73
A59. Patent applications by office and origin, 2017 74
A60. Patent grants by office and origin, and patents in force, 2017 79
A61. Patent office procedural data, 2017 83
A62. Utility model applications and grants by office and origin, 2017 85
B1. Trend in trademark applications worldwide, 2004-2017 99
B2. Trend in trademark application class counts worldwide, 2004-2017 99
B3. Resident and non-resident trademark application class counts worldwide, 2004-2017 100
B4. Trend in trademark registrations worldwide, 2004-2017 100
B5. Trend in trademark registration class counts worldwide, 2004-2017 101
B6. Resident and non-resident trademark registration class counts worldwide, 2004-2017 101
B7. Trademark application class counts by income group, 2007 and 2017 102
B8. Trademark application class counts by region, 2007 and 2017 102
B9. Trend in trademark applications for the top five offices, 1883-2017 102
B10. Trademark application class counts for the top 20 offices, 2017 103
B11. Contribution of resident and non-resident application class counts to total growth for the top 20 offices, 2016-2017 103
B12. Trademark application class counts for offices of selected low- and middle-income countries, 2017 104
B13. Contribution of resident and non-resident application class counts to total growth for offices of selected low- and middle-income countries, 2016-2017 104
B14. Trademark registration class counts by income group, 2007 and 2017 105
B15. Trademark registration class counts by region, 2007 and 2017 105
B16. Trend in trademark registrations for the top five offices, 1883-2017 105
B17. Trademark registration class counts for the top 20 offices, 2017 106
B18. Trademark registration class counts for offices of selected low- and middle-income countries, 2017 106
B19. Equivalent trademark application class counts by origin, 2017 107
B20. Trademark application class counts for the top 20 origins, 2017 107
B21. Trademark application class counts for selected low- and middle-income origins, 2017 108
B22. Trademark application class counts abroad for the top 20 origins, 2017 108
B23. Trademark application class counts for the top 25 offices and origins, 2017 109
B24. Flows of non-resident trademark application class counts between selected top origins and offices, 2017 111
B25. Distribution of trademark application class counts for the top 15 offices and selected non-resident origins, 2017 112
B26. Distribution of trademark applications by top Nice classes, 2017 113
B27. Trademark applications by goods and services classes, 2017 113
B28. Trademark applications by industry sector, 2017 114
B29. Trademark applications by top three sectors at the top offices, 2017 115
B30. Distribution of trademark applications by goods and services at the top offices, 2017 115
B31. Trademark applications by top three sectors for the top origins, 2017 116
B32. Distribution of trademark applications by goods and services for the top origins, 2017 116
B33. Resident trademark application class count per USD 100 billion GDP for selected origins, 2007 and 2017 117
B34. Resident trademark application class count per million population for selected origins, 2007 and 2017 117
B35. Collective trademark applications for the top 20 offices, 2017 118
B36. Certification trademark applications for the top 20 offices, 2017 118
B37. Trend in trademark registrations in force worldwide, 2010-2017 119
B38. Trademark registrations in force for the top 20 offices, 2017 119
B39. Trademark registrations in force in 2017 as a percentage of total registrations recorded between 1991 and 2017 120
B40. Average age of trademarks in force at selected offices, 2012 and 2017 120
B41. Trademark examination decisions for selected offices, 2017 121
B42. Trademark applications pending for selected offices, 2017 121
B43. Trademark examiners for selected offices, 2017 122
B44. Duration of trademark examination for selected offices, 2017 122
B45. Third party oppositions for selected offices, 2017 123
B46. Appeals to decisions by selected offices, 2017 123
B47. Trend in Madrid international applications, 2004-2017 124
B48. Madrid international applications by origin, 2017 124
B49. Madrid applications for the top 20 origins, 2017 125
B50. Designations in Madrid international applications for the top 20 designated Madrid members, 2017 125
B51. Trademark applications by office and origin, 2017 126
B52. Trademark registrations by office and origin, and trademarks in force, 2017 131
B53. Trademark office procedural data, 2017 136
C1. Trend in industrial design applications worldwide, 2004-2017 146
C2. Trend in application design counts worldwide, 2004-2017 146
C3. Resident and non-resident application design counts worldwide, 2004-2017 147
C4. Trend in industrial design registrations worldwide, 2004-2017 147
C5. Trend in registration design counts worldwide, 2004-2017 148
C6. Resident and non-resident registration design counts worldwide, 2004-2017 148
C7. Application design counts by income group, 2007 and 2017 149
C8. Application design counts by region, 2007 and 2017 149
C9. Trend in industrial design applications for the top five offices, 1883-2017 150
C10. Application design counts for the top 20 offices, 2017 150
C11. Contribution of resident and non-resident application design counts to total growth for the top 20 offices, 2016-2017 151
C12. Application design counts for offices of selected low- and middle-income countries, 2017 151
C13. Contribution of resident and non-resident application design counts to total growth for offices of selected low- and middle-income countries, 2016-2017 152
C14. Registration design counts for the top 20 offices, 2017 152
C15. Registration design counts for offices of selected low- and middle-income countries, 2017 153
C16. Equivalent application design counts by origin, 2017 154
C17. Equivalent application design counts for the top 20 origins, 2017 154
C18. Application design counts for the top 20 origins, 2017 155
C19. Application design counts for selected low- and middle-income origins, 2017 155
C20. Flows of non-resident design counts for the top five origins and the top 10 offices of high-income economies, 2017 156
C21. Flows of non-resident design counts for the top five origins and the top 10 offices of low- and middle-income economies, 2017 157
C22. Application design counts by Locarno class, 2017 158
C23. Distribution of application design counts by the top three sectors and for the top 10 offices, 2017 158
C24. Distribution of application design counts by the top three sectors for the top 10 origins, 2017 159
C25. Resident application design count per USD 100 billion of GDP for the top 20 origins, 2007 and 2017 160
C26. Resident application design count per million population for the top 20 origins, 2007 and 2017 160
C27. Trend in industrial design registrations in force worldwide, 2010-2017 161
C28. Industrial design registrations in force for the top 20 offices, 2017 161
C29. Industrial design registrations in force in 2017 as a percentage of total registrations 162
C30. Average age of industrial design registrations in force at selected offices, 2012 and 2017 162
C31. Trend in designs contained in Hague international applications, 2004-2017 163
C32. Designs contained in Hague international applications by origin, 2017 163
C33. Designs contained in Hague international applications for the top 20 origins, 2017 164
C34. Designs contained in designations in Hague international applications for the top 20 designated Hague members, 2017 164
C35. Industrial design applications by office and origin, 2017 165
C36. Industrial design registrations by office and origin, and industrial designs in force, 2017 169
D1. Trend in plant variety applications worldwide, 2003-2017 179
D2. Trend in plant variety titles issued worldwide, 2003-2017 179
D3. Plant variety applications by income group, 2007 and 2017 180
D4. Plant variety applications by region, 2007 and 2017 180
D5. Plant variety applications for the top 20 offices, 2017 181
D6. Contribution of resident and non-resident applications to total growth for the top 20 offices, 2016-2017 181
D7. Plant variety applications for offices of selected low- and middle-income countries, 2017 182
D8. Plant variety titles issued by the top 20 offices, 2017 182
D9. Equivalent plant variety applications by origin, 2017 183
D10. Plant variety applications for the top 20 origins, 2017 183
D11. Plant variety applications abroad for the top 20 origins, 2017 184
D12. Plant variety titles issued for the top 20 origins, 2017 184
D13. Plant variety titles issued abroad for the top 20 origins, 2017 185
D14. Trend in plant variety titles in force worldwide, 2003-2017 186
D15. Plant variety titles in force at selected offices, 2017 186
D16. Plant variety applications and titles issued by office and origin, and plant variety titles in force by office, 2017 187
F1. Trade sector revenue, 2017 199
F2. Distribution of the trade sector revenue by format type, 2017 199
F3. Distribution of the trade sector revenue by destination, 2017 200
F4. Number of titles published by the trade sector, 2017 200
F5. Distribution of titles published by the trade sector by format, 2017 201
F6. Number of copies sold by the trade sector, 2017 201
F7. Distribution of copies sold by sales channel for the trade sector, 2017 202
F8. Educational sector revenue, 2017 203
F9. Distribution of the educational sector revenue by format, 2017 203
F10. Distribution of the educational sector revenue by destination, 2017 204
F11. Number of titles published by the educational sector, 2017 204
F12. Distribution of titles published by the educational sector by format, 2017 205
F13. Number of copies sold by the educational sector, 2017 205
F14. Distribution of copies sold by sales channel for the educational sector, 2017 206
F15. STM sector revenue, 2017 207
F16. Number of titles published by the STM sector, 2017 207
F17. Total net publishing industry revenue by sector, 2017 208
F18. Total number of titles published by sector, 2017 209
F19. Total number of copies sold by sector, 2017 210

This authoritative report analyzes IP activity around the globe. Covering the filing, registration and maintenance of patents, utility models, trademarks, industrial designs, microorganisms, and plant variety protection, and geographical indications, the 2018 edition also looks at the creative economy for the first time, making it even more comprehensive. The special theme explores how one might statistically capture patent litigation activity and presents selected statistics for the United Kingdom and the United States of America.
*표시는 필수 입력사항입니다.
| 전화번호 |
|---|
| 기사명 | 저자명 | 페이지 | 원문 | 기사목차 |
|---|
| 번호 | 발행일자 | 권호명 | 제본정보 | 자료실 | 원문 | 신청 페이지 |
|---|
도서위치안내: / 서가번호:

우편복사 목록담기를 완료하였습니다.
*표시는 필수 입력사항입니다.
저장 되었습니다.
