 https://www.wipo.int/publications/en/details.jsp?id=4756&plang=EN


권호기사보기
| 기사명 | 저자명 | 페이지 | 원문 | 기사목차 |
|---|
| 대표형(전거형, Authority) | 생물정보 | 이형(異形, Variant) | 소속 | 직위 | 직업 | 활동분야 | 주기 | 서지 | |
|---|---|---|---|---|---|---|---|---|---|
| 연구/단체명을 입력해주세요. | |||||||||
|
|
|
|
|
|
* 주제를 선택하시면 검색 상세로 이동합니다.
Title page
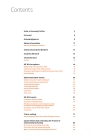
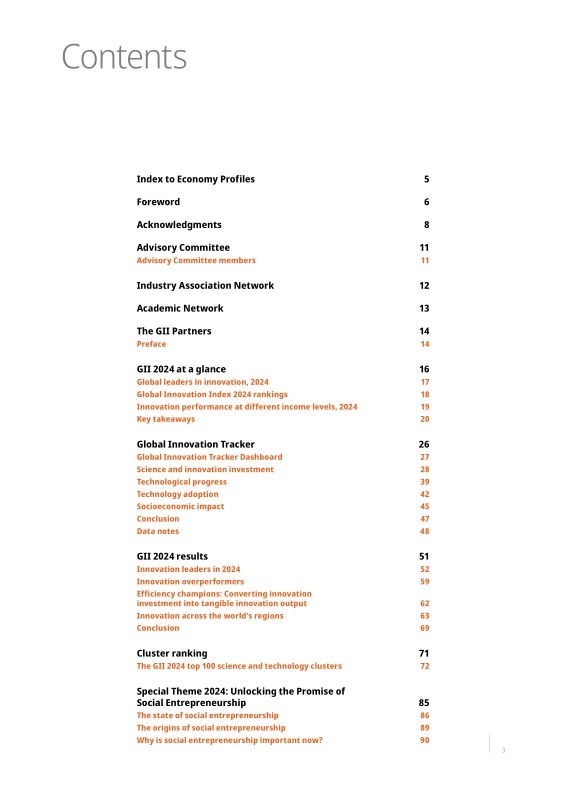
Contents
Index to Economy Profiles 6
Foreword 7
Acknowledgments 9
Advisory Committee 12
Advisory Committee members 12
Industry Association Network 13
Academic Network 14
The GII Partners 15
Preface 15
GII 2024 at a glance 17
Global leaders in innovation, 2024 18
Global Innovation Index 2024 rankings 19
Innovation performance at different income levels, 2024 20
Key takeaways 21
Global Innovation Tracker 27
Global Innovation Tracker Dashboard 28
Science and innovation investment 29
Technological progress 40
Technology adoption 43
Socioeconomic impact 46
Conclusion 48
Data notes 49
GII 2024 results 52
Innovation leaders in 2024 53
Innovation overperformers 60
Efficiency champions: Converting innovation investment into tangible innovation output 63
Innovation across the world's regions 64
Conclusion 70
Cluster ranking 72
The GII 2024 top 100 science and technology clusters 73
Special Theme 2024: Unlocking the Promise of Social Entrepreneurship 86
The state of social entrepreneurship 87
The origins of social entrepreneurship 90
Why is social entrepreneurship important now? 91
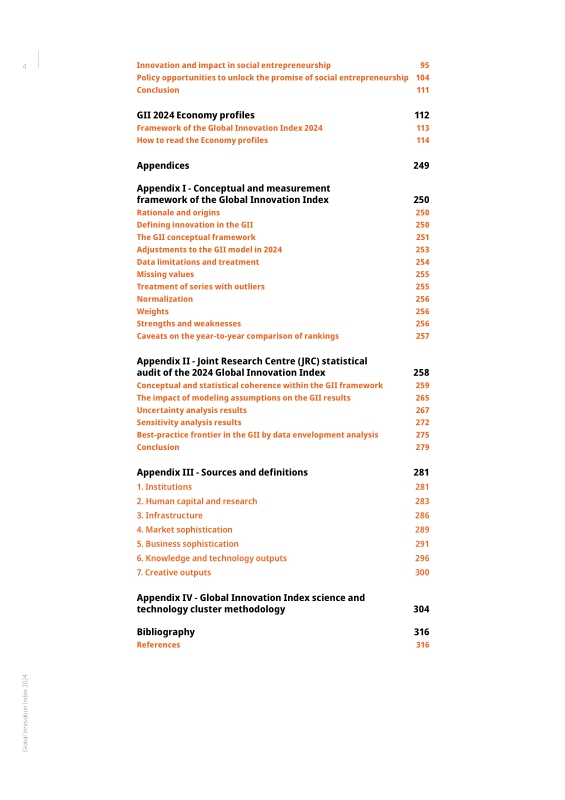
Innovation and impact in social entrepreneurship 96
Policy opportunities to unlock the promise of social entrepreneurship 105
Conclusion 112
GII 2024 Economy profiles 113
Framework of the Global Innovation Index 2024 114
How to read the Economy profiles 115
Appendix I - Conceptual and measurement framework of the Global Innovation Index 251
Rationale and origins 251
Defining innovation in the GII 251
The GII conceptual framework 252
Adjustments to the GII model in 2024 254
Data limitations and treatment 255
Missing values 256
Treatment of series with outliers 256
Normalization 257
Weights 257
Strengths and weaknesses 257
Caveats on the year-to-year comparison of rankings 258
Appendix II - Joint Research Centre (JRC) statistical audit of the 2024 Global Innovation Index 259
Conceptual and statistical coherence within the GII framework 260
The impact of modeling assumptions on the GII results 266
Uncertainty analysis results 268
Sensitivity analysis results 273
Best-practice frontier in the GII by data envelopment analysis 276
Conclusion 280
Appendix III - Sources and definitions 282
1. Institutions 282
2. Human capital and research 284
3. Infrastructure 287
4. Market sophistication 290
5. Business sophistication 292
6. Knowledge and technology outputs 297
7. Creative outputs 301
Appendix IV - Global Innovation Index science and technology cluster methodology 305
Bibliography 317
References 317
Table 1. R&D growth rates of top global corporate R&D spenders, 2019-2023 32
Table 2. Top 10 Economies by income group 59
Table 3. Innovation overperformers in 2024: Income group, region and years as an 61 innovation overperformer 62
Table 4. Heatmap: GII 2024 rankings overall and by innovation pillar, 2024 65
Table 5. Top S&T cluster by economy or cross-border region ranked among the top 100, 2024 75
Table 6. Economies with three or more top 100 S&T clusters, 2024 76
Table 7. Top S&T clusters in extended ranking, economies not covered by the top 100 S&T 79 clusters, 2024 80
Table 8. Top science or S&T clusters within Africa 82
Table 9. Top 25 S&T clusters by S&T intensity, 2024 83
Table 10. Top 5 issues addressed by social entrepreneurship globally 89
Table 11. Top 5 financing sources for social entrepreneurship 94
Table 12. Organizational pathways to impact in social entrepreneurship 97
Table 13. Forms of systems innovation in social entrepreneurship 105
Table 14. Barriers and opportunities in social entrepreneurship 106
Figure 1. Number of scientific publications (millions), 2013-2023 30
Figure 2. GDP growth and total and business R&D growth rates, 2007-2025 31
Figure 3a. Nominal R&D expenditure of top R&D spenders by industry and year, 2019-2023 32
Figure 3b. Intensity of top R&D spenders by industry and year, 2019-2023 33
Figure 4. Top R&D spenders by industry, growth rate 2022-2023 34
Figure 5a. Quarterly value of venture capital deals, 1997-2024, 3-point moving average 38
Figure 5b. Number of venture capital deals, 1997-2024, 3-point moving average 39
Figure 6. Regional distribution of venture capital deal value, 1997 and 2023 39
Figure 7. Patent filings growth, 2009-2023 40
Figure 8. Average speed, power and efficiency of top 50 green supercomputers, 2013-2023 41
Figure 9. Average lithium-ion battery price, 2013-2023 42
Figure 10. Number of yearly drug launches, by therapeutic area, 2013-2023 43
Figure 11. Population coverage by type of mobile network, 2015-2023 44
Figure 12. Population living in poverty, by income threshold, 1981-2022, USD PPP 2017 46
Figure 13. Life expectancy and healthy life expectancy at birth (years), 2000-2022 47
Figure 14. Global temperature anomaly, 1951-2023 land-ocean global mean temperature 48
Figure 15. Carbon dioxide emissions, 2007-2022 (gigatonnes of carbon) 48
Figure 16. The GII dynamo: The top 15 innovators, 2020-2024 55
Figure 17a. Breaking barriers: Economies soaring to new heights in innovation, 2024 57
Figure 17b. Economies climbing the ladder 58
Figure 18. Innovation overperformers, relative to their economic development 61
Figure 19. Innovation input to output performance, 2024 64
Figure 20. Prevalence of social entrepreneurship among early-stage entrepreneurs, 2021-2022 92
Maps
Map 1. Top 100 clusters worldwide, 2024 74
Map 2a. Top S&T clusters, East Asia, 2024 77
Map 2b. Top S&T clusters, United States, 2024 78
Map 2c. Top S&T clusters, Middle East, 2024 78
Map 2d. Top S&T clusters, Malaysia and Singapore, 2024 79
Map 3. Top science or S&T clusters within Africa 81
Map 4a. European S&T clusters by intensity, 2024 84
Map 4b. United States S&T clusters by intensity, 2024 85
Boxes
Box 1. GII innovation indicators - 2024 trailblazers 53
Box 2. How to best use the Global Innovation Index and what not to do 59
Box 3. Innovation as the driver of the United Nations Sustainable Development Goals 69
Box 4. The customer pathway in action 98
Box 5. The employee pathway in action 99
Box 6. The product/service pathway in action 100
Box 7. The ecosystem pathway in action 101
Box Tables
Box Table 1. Economies with the most GII indicators ranked top, 2024 54
Appendix Table 1. Changes to the GII 2024 framework 255
Appendix Table 2. Statistical coherence in the GII: correlations between sub-pillars and pillars 264
Appendix Table 3. Distribution of differences between pillar and GII rankings 265
Appendix Table 4. Uncertainty parameters: missing values, aggregation and weights 267
Appendix Table 5. GII 2024 and Input/Output Sub-Indices: rankings and 90 percent confidence intervals 270
Appendix Table 6. Sensitivity analysis: impact of modeling choices on countries with the most sensitive rankings 275
Appendix Table 7a. Pie shares (absolute terms) and efficiency scores for the top 25 GII 2024 economies - input pillars 278
Appendix Table 7b. Pie shares (absolute terms) and efficiency scores for the top 25 GII 2024 economies - output pillars 279
Appendix Table 8. Top 100 S&T clusters, 2024 307
Appendix Table 9. Ranking of S&T intensity 310
Appendix Table 10. Summary of geocoding results 313
Appendix Table 11. African S&T clusters 314
Appendix Figure 1. Robustness analysis of the GII, Input and Output Sub-Indices 268
Appendix Figure 2. GII 2024 scores and DEA "distance to the best-practice frontier" scores 280
Appendix Boxes
Appendix I - Conceptual and measurement framework of the Global Innovation Index 253
Appendix Box 1. Building a robust data infrastructure for the Global Innovation Index 253
Appendix II - Joint Research Centre (JRC) statistical audit of the 2024 Global Innovation Index 260
Box 1. Conceptual and statistical coherence in the GII 2024 framework 260
*표시는 필수 입력사항입니다.
| *전화번호 | ※ '-' 없이 휴대폰번호를 입력하세요 |
|---|
| 기사명 | 저자명 | 페이지 | 원문 | 기사목차 |
|---|
| 번호 | 발행일자 | 권호명 | 제본정보 | 자료실 | 원문 | 신청 페이지 |
|---|
도서위치안내: / 서가번호:

우편복사 목록담기를 완료하였습니다.
*표시는 필수 입력사항입니다.
저장 되었습니다.
