
 대표어
대표어
 https://op.europa.eu/en/publication-detail/-/publication/30c1ccaa-bfdd-11f0-a612-01aa75ed71a1/language-en?WT.mc_id=Selectedpublications&WT.ria_c=41957&WT.ria_f=6415&WT.ria_ev=search


권호기사보기
| 기사명 | 저자명 | 페이지 | 원문 | 기사목차 |
|---|
결과 내 검색
동의어 포함
Title page 1
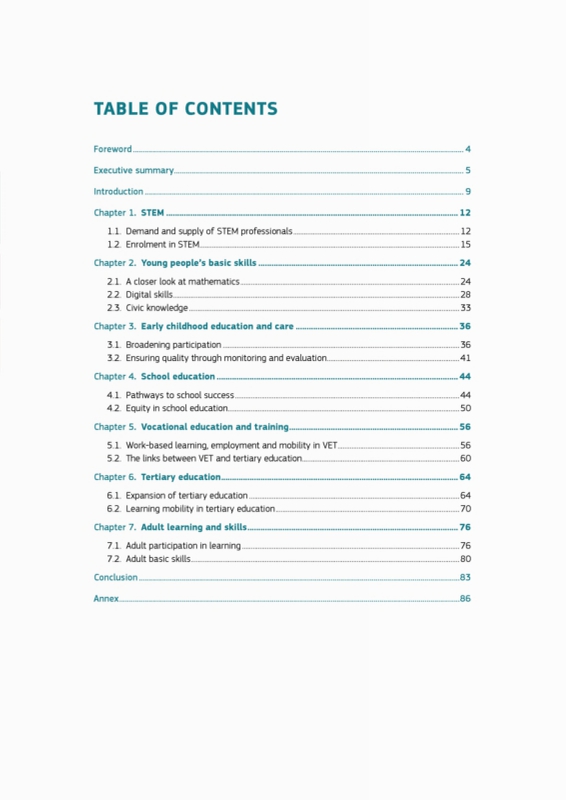
Contents 5
FOREWORD 6
EXECUTIVE SUMMARY 7
INTRODUCTION 11
CHAPTER 1. STEM 14
1.1. Demand and supply of STEM professionals 14
1.2. Enrolment in STEM 17
1.2.1. Current trends 17
1.2.2. Drivers of study choice 20
1.2.3. Gender gaps in STEM 22
CHAPTER 2. YOUNG PEOPLE'S BASIC SKILLS 26
2.1. A closer look at mathematics 26
2.2. Digital skills 30
2.3. Civic knowledge 35
CHAPTER 3. EARLY CHILDHOOD EDUCATION AND CARE 38
3.1. Broadening participation 38
3.2. Ensuring quality through monitoring and evaluation 43
CHAPTER 4. SCHOOL EDUCATION 46
4.1. Pathways to school success 46
4.1.1. Finishing upper secondary education 46
4.1.2. Con fronting early school leaving 48
4.1.3. Preventing disengagement from school 50
4.2. Equity in school education 52
4.2.1. Helping disadvantaged students succeed 52
4.2.2. Supporting all learners to develop their talents 55
CHAPTER 5. VOCATIONAL EDUCATION AND TRAINING 58
5.1. Work-based learning, employment and mobility in VET 58
5.2. The links between VET and tertiary education 62
CHAPTER 6. TERTIARY EDUCATION 66
6.1. Expansion of tertiary education 66
6.1.1. Tertiary educational attainment 66
6.1.2. Broadening participation in tertiary education 68
6.2. Learning mobility in tertiary education 72
6.2.1. Going abroad 72
6.2.2. Choosing Europe 73
CHAPTER 7. ADULT LEARNING AND SKILLS 78
7.1. Adult participation in learning 78
7.2. Adult basic skills 82
CONCLUSION 85
ANNEX 88
Figures 15
Figure 1. Overall forecast employment change and replacement demand. Total and selected STEM occupations, 2022-2035 15
Figure 2. The EU faces uneven distribution of STEM graduates amid growing demand 16
Figure 3. Most VET students in STEM are in engineering, manufacturing and construction 18
Figure 4. More than one in four tertiary students are enrolled in STEM fields 19
Figure 5. Wide country disparities exist in ICT enrolment at doctoral level 20
Figure 6. The gender gap is severe in some subfields, yet slowly improving at tertiary level 23
Figure 7. Only a moderate daily use of digital tools for learning is positively associated with mathematics performance 28
Figure 8. No less than 42.5% of students in grade 8 (13-14 years-old) score below the minimum threshold in computer and information literacy 31
Figure 9. The proportion of 15-year-old boys who cyberbully others is on the rise (2018-2022) 34
Figure 10. Almost two thirds of students know about and understand the most pervasive civic and citizenship institutions, systems and concepts 36
Figure 11. Most of EU countries have participation above 90% 39
Figure 12. Participation in formal childcare or education has increased substantially in the past decade 41
Figure 13. Inequalities have grown in participation in formal childcare or education 42
Figure 14. Where centre-based ECEC evaluation exists, process quality is more often considered a factor when it comes to older children 44
Figure 15. Half of EU education systems did not carry out evaluation of the quality of ECEC at national level between 2018 and 2023 45
Figure 16. By age 24, enrolment in secondary education is negligible and attainment is at 86.6% 47
Figure 17. Early school leaving is down to 9.4%, nearing the target of less than 9% 48
Figure 18. Early school leaving rates exceed 20% for young people born abroad 49
Figure 19. EU countries use multi-targeted responses to tackle absenteeism and non-enrolment 51
Figure 20. Across the EU, 16.3% of students reach at least a good level of achievement in reading, mathematics or science despite their disadvantaged socio-economic background 54
Figure 21. Grade repetition entrenches the effect of socio-economic background 56
Figure 22. Work-based learning varies widely across countries 59
Figure 23. Employment rates of recent VET graduates slightly decreased in the EU on average 61
Figure 24. Learner mobility in VET increased slightly in 2023 in the EU 62
Figure 25. Seven out of ten upper secondary VET students in the EU have direct access to tertiary education, with major differences by country 63
Figure 26. Professionally-oriented programmes account for a majority of the enrolment in tertiary education in several EU countries 65
Figure 27. The EU has almost reached the EU-level target on tertiary attainment 67
Figure 28. Parental background exerts a high influence on access to tertiary education 68
Figure 29. Only a few EU countries monitor student characteristics after students enter tertiary education 69
Figure 30. Only in half of all EU education systems validate non-formal and informal learning to allow access to tertiary education programmes 71
Figure 31. Outward mobility remains limited 73
Figure 32. Extra-EU inward mobility originates mainly from Asia and Africa and is highly unbalanced across EU countries 75
Figure 33. EU education systems are becoming more attractive to non-EU countries 76
Figure 34. Adult learning participation varies significantly across countries and data sources 79
Figure 35. While women participate more in learning overall, they have been under-represented in job-related learning 81
Figure 36. Average performance in literacy, numeracy and adaptive problem-solving varies greatly across countries 82
Figure 37. Around one in five adults has low proficiency in numeracy and literacy 83
Figure 38. At least basic literacy skills and at least basic digital skills tend to go hand in hand among adults 84
Figure 39. Work-based learning in VET records the highest variability 85
Figure 40. Significant improvements in basic skills and adult learning are needed 86
Boxes 21
Box 1. STEM school education 21
Box 2. Addressing gender bias in STEM 25
Box 3. Smartphone bans in schools 27
Box 4. Promoting excellence 30
Box 5. Generative AI: what possible impact on education? 32
Box 6. Cyberbullying on the rise 34
Box 7. Promoting civic knowledge at school 37
Box 8. Early literacy development 40
Box 9. Increasing participation in ECEC 43
Box 10. Effective school-level measures to prevent early school leaving 50
Box 11. Other determinants of educational disadvantage 55
Box 12. Strengthening apprenticeships as a key work-based learning approach 60
Box 13. Tackling dropping out of higher education 70
Box 14. Union of Skills - upcoming reskilling and upskilling actions 80
*표시는 필수 입력사항입니다.
| 전화번호 |
|---|
| 기사명 | 저자명 | 페이지 | 원문 | 기사목차 |
|---|
| 번호 | 발행일자 | 권호명 | 제본정보 | 자료실 | 원문 | 신청 페이지 |
|---|
도서위치안내: / 서가번호:

우편복사 목록담기를 완료하였습니다.
*표시는 필수 입력사항입니다.
저장 되었습니다.
