
 대표어
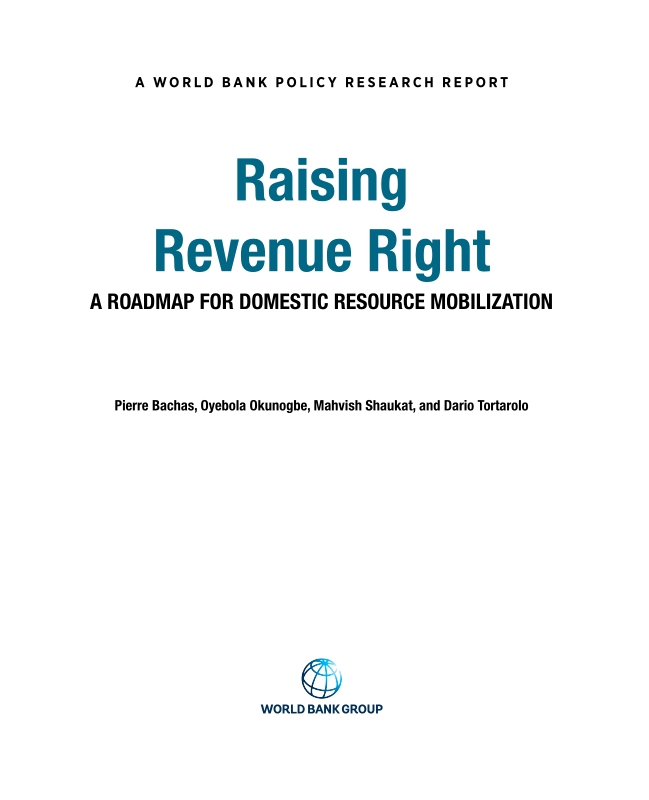
 https://documents.worldbank.org/en/publication/documents-reports/documentdetail/099025509162610059






권호기사보기
| 기사명 | 저자명 | 페이지 | 원문 | 기사목차 |
|---|
결과 내 검색
동의어 포함
Title page 1
Contents 7
Foreword 14
Acknowledgments 17
About the Authors 19
Overview 21
Abbreviations 36
Part I. Setting the Stage 41
CHAPTER 1. A Framework for the Fiscal Frontier 42
A simple framework for how tax systems balance revenue, efficiency, and equity 42
Mapping countries to the fiscal frontier 52
References 58
CHAPTER 2. Efficiency and Equity in Current Tax Systems 59
Introduction 59
Tax mix across development levels 60
Efficiency shortcomings in domestic revenue mobilization 68
Equity shortcomings in domestic revenue mobilization 80
Efficiency meets equity: Priorities for reform 87
Annex 2A. Efficiency of the main tax instruments 91
Notes 95
References 97
Part II. A New Path to the Fiscal Frontier: Technology, Transparency, and Trust 107
CHAPTER 3. Technology in Tax Administration 108
Introduction 108
Growing use of technology for taxation 109
Use of technology for core tax functions 117
Essential ingredients for successful technology reforms 130
Policy lessons 134
Annex 3A. Sources for figure 3.6 136
Notes 138
References 139
CHAPTER 4. Transparency and Taxation of Top Economic Actors 146
Introduction 146
Top economic actors 148
The ABCD of international taxation 159
Opportunities to tax top economic actors 174
Notes 188
References 188
CHAPTER 5. Trust and the Political Economy of Taxation 199
Introduction 199
Politicians and citizens 204
Politicians and bureaucrats 217
Bureaucrats and citizens 223
Policy lessons for property tax reform 227
Notes 230
References 230
Part III. Toolkit and Applications 242
CHAPTER 6. Taxation for Environmental and Industrial Goals 243
Introduction 243
Environmental taxes 244
Tax policy for industrial goals 262
Notes 286
References 289
CHAPTER 7. How Much Tax Revenue to Collect and How? A Marginal Value of Public Funds Approach 299
Introduction 299
The WMVPF framework: Choosing how to raise revenue 301
Calculating WMVPFs: Three tax policy examples 303
Should a government raise additional revenue at all? 309
Moving away from optimal tax-to-GDP ratios 311
Annex 7A. The Welfare-Weighted Marginal Value of Public Funds 314
Notes 331
References 332
CHAPTER 8. Administrative Tax Data for Policy 334
Introduction 334
Innovative data to learn about the economy 337
Building collaborations: Practical models for every need 345
Analytical tools for big administrative data 355
Lurking in the shadows: What are we missing? 364
From tax records to data-driven policy making: A roadmap for strengthening tax data use 368
Note 370
References 370
CHAPTER 9. Policy Guidance 375
Introduction 375
How can countries identify tax reforms that are feasible and appropriate? 375
Linking feasibility and performance: The reform space 378
How can the 3Ts strengthen core tax instruments? 382
How should countries balance the tax mix? 390
How can countries build the tax systems of the future? 391
References 392
Figure O.1. Stagnant tax revenues, growing fiscal pressure 23
Figure O.2. Tax systems in EMDEs are less efficient and less equitable 24
Figure O.3. The equity-efficiency frontier (holding revenue fixed) 25
Figure O.4. Countries close to and far from the frontier, by structural fundamentals 26
Figure O.5. The 3Ts: Accelerating progress and expanding possibilities 28
Figure 1.1. The fiscal frontier 44
Figure 1.2. The fiscal frontier and the status quo 45
Figure 1.3. The 3Ts and the expanded fiscal frontier 48
Figure 1.4. Fiscal frontiers and structural fundamentals 49
Figure 1.5. Fiscal frontiers at different revenue levels 51
Figure 1.6. Fiscal frontiers by tax-to-GDP ratios 55
Figure 1.7. Fiscal frontier for countries with strong and weak fundamentals 56
Figure 2.1. Revenue mix across income groups and regions 63
Figure 2.2. Tax system efficiency across levels of development, 2018-23 66
Figure 2.3. Inequality before and after taxes and transfers, by income level, 2018-23 67
Figure 2.4. Statutory tax rates on consumption, corporate, and personal income, 2019 69
Figure 2.5. SSC and payroll tax rates and wedges, by income group 70
Figure 2.6. Tax thresholds, by income group and region 71
Figure 2.7. Tax expenditures as a share of tax revenue, 2018-22 73
Figure 2.8. Tax efficiency indicators, by income group and region 79
Figure 2.9. Welfare impacts of taxes and transfers 83
Figure 2.10. Progressivity and redistribution of PIT, 2024 84
Figure 2.11. Welfare impacts of direct and indirect taxes 85
Figure 2.12. Taxes paid as a share of pretax income, average among poorest 50 percent 86
Figure 2.13. Average PIT threshold to poverty and prosperity standards 88
Figure 3.1. Diffusion of core government systems across countries over time 112
Figure 3.2. Technology adoption in tax administration, ISORA data, 2018-23 113
Figure 3.3. Innovative solutions adoption in tax administration, ISORA data, 2023 114
Figure 3.4. Data sharing in tax administration, OECD data, 2023 115
Figure 3.5. Pre-filling in tax administration, OECD data, 2023 116
Figure 3.6. Impacts of digital reforms on tax performance: Evidence from the literature since 2011 129
Figure 4.1. Importance of MNEs to economic activity and corporate tax revenues 150
Figure 4.2. Racing to the bottom in CIT rates 151
Figure 4.3. A nuanced take on tax competition 153
Figure 4.4. Annual income needed to belong to the richest 1 percent, 2023 155
Figure 4.5. Income composition of the top 0.1 percent, by country 157
Figure 4.6. Macroeconomic effective tax rates on labor income and capital, by country group and region, 2018 158
Figure 4.7. International taxation data generation process 160
Figure 4.8. Adoption of BORs 167
Figure 4.9. Factors that affect MNEs' investment decisions 183
Figure 4.10. New strategies for tax evasion and avoidance 185
Figure 5.1. Political actors and taxation 200
Figure 6.1. Environmentally related tax revenues and total carbon pricing over time, by income group 247
Figure 6.2. Earmarking of environmentally related taxes 252
Figure 6.3. Tax expenditures for investment, 2018-23 265
Figure 6.4. Tax incentives for investment, by tax and policy type, 2018-23 270
Figure 6.5. Revenue forgone from CIT tax expenditures for investment, by tax incentive and income group 272
Figure 6.6. Tax-related obstacles to business activity, 2018-25 282
Figure 8.1. Digital expansion in tax administrations, by income group 335
Figure 8.2. Administrative tax data generation process 338
Figure 8.3. Wage gains in Costa Rica, by type of move, 2006-17 340
Figure 8.4. Firm ownership in the Dominican Republic, 2010-18 340
Figure 8.5. Likelihood of switching jobs in Brazil, by age group, 1994-2017 341
Figure 8.6. VAT amounts declared by sellers and buyers in Uganda, 2013-16 341
Figure 8.7. Impact of road flooding on sales in Pakistan, 2011-18 342
Figure 8.8. County-level trade flows between formal firms in Kenya, 2015-19 342
Figure 8.9. Composition of top incomes in Honduras, 2011-19 343
Figure 8.10. Effective tax rate across the income distribution in Brazil, 2019 343
Figure 8.11. Reported consumption drops after becoming a business manager in Portugal, 2016-19 343
Figure 8.12. VAT rebates in Brazil, by income and consumption levels, 2023 344
Figure 8.13. Near-real-time information on consumer prices in Brazil 344
Figure 8.14. When do governments pay more? Brazil, 2018-23 345
Figure 8.15. Types of collaboration models 346
Figure 8.16. Simple descriptive analyses can be very informative 356
Figure 8.17. Bunching at a tax notch: Incentives and responses in Honduras 358
Figure 8.18. Regression discontinuity: Tax audit risk and recovered revenue in China 360
Figure 8.19. Using image-based ML to identify property characteristics in Pakistan 362
Figure 8.20. Tracking crises with e-invoicing data in Brazil 363
Figure 8.21. Limitations of administrative tax data 365
Figure 9.1. Locating countries in the reform space 379
Figure 9.2. Locating countries in the reform space: Regional classification 380
Boxes 9
Box 1.1. Moving toward the fiscal frontier: Brazil's consumption tax reform 46
Box 1.2. AI and the future of taxation in EMDEs 50
Box 1.3. Measurement considerations in mapping the fiscal frontier 52
Box 2.1. Structure of taxation across development levels 60
Box 2.2. How gaps between personal and corporate taxation create arbitrage 74
Box 2.3. Tax rate dispersion and misallocation 77
Box 2.4. Tax incidence in developing countries 81
Box 3.1. DPI and tax systems 110
Box 3.2. Technology solutions: From most revenue impactful to more tentative 117
Box 3.3. MM taxes: A double-edged sword 121
Box 3.4. AI and ML for tax systems in LMICs 124
Box 4.1. Limited data on MNEs' activities 149
Box 4.2. Architecture of the AEOI: FATCA and CRS 162
Box 4.3. Two-pillar solution to address corporate income tax erosion 171
Box 4.4. Taxing capital: Income or wealth? 175
Box 4.5. Cross-country comparison of PIT exemption thresholds 179
Box 5.1. A closer look at citizens' trust in the state 201
Box 5.2. Political regimes, citizen voice, and taxation 208
Box 5.3. State capacity for taxation 212
Box 5.4. Smart tax reform: Choosing the right strategy and timing 216
Box 5.5. Do SARAs deliver? 220
Box 5.6. Social norms and taxes 224
Box 6.1. Climate clubs and coalitions 255
Box 6.2. Taxonomy of CIT investment incentives 268
Box 6.3. Taxonomy of complementary nontax instruments 273
Box 7.1. Key takeaways on the marginal value of public funds 300
Box 7.2. How to use the WMVPF in practice 303
Box 7.3. Raising the VAT rate in Mexico 304
Box 7.4. Raising the top personal income tax rate in Mexico 306
Box 7.5. Improved tax administration versus raising the CIT rate in Indonesia 307
Box 7.6. Raising tax revenue in Mexico to fund a street-paving project 309
Box 8.1. Breaking data silos for smarter policy 349
Box 8.2. South Africa's National Treasury Secure Data Facility 351
Box 8.3. Ethical governance of tax data 367
Box 9.1. Revenue adequacy and the fiscal frontier 378
Box 9.2. Evidence-based fiscal policy 391
Figure B2.1.1. Tax revenue structure across development levels 61
Figure B2.2.1. Arbitrage wedges between PIT and CIT 75
Figure B2.3.1. Levels and Dispersion of CIT Rates 78
Figure B3.1.1. DPI, by income group 110
Figure B3.3.1. Impact of MM taxes on transaction values in Ghana, Kenya, Tanzania, Uganda, and Zambia 123
Figure B4.5.1. PIT exemption thresholds and wage employment 179
Figure B5.1.1. Trust in government, by income group 201
Figure B5.1.2. Trust in government over time 202
Figure B5.3.1. Tax revenue and corruption, by income and regime type 214
Figure B7.6.1. Welfare change from two revenue-raising policies and one spending policy in Mexico 310
Figure 2A.1. Top statutory income tax rates, by income group and type 94
*표시는 필수 입력사항입니다.
| 전화번호 |
|---|
| 기사명 | 저자명 | 페이지 | 원문 | 기사목차 |
|---|
| 번호 | 발행일자 | 권호명 | 제본정보 | 자료실 | 원문 | 신청 페이지 |
|---|
도서위치안내: / 서가번호:

우편복사 목록담기를 완료하였습니다.
*표시는 필수 입력사항입니다.
저장 되었습니다.
