
 대표어
 https://www.wipo.int/publications/en/details.jsp?id=4873&plang=EN

권호기사보기
| 기사명 | 저자명 | 페이지 | 원문 | 기사목차 |
|---|
결과 내 검색
동의어 포함
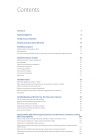
Title page 1
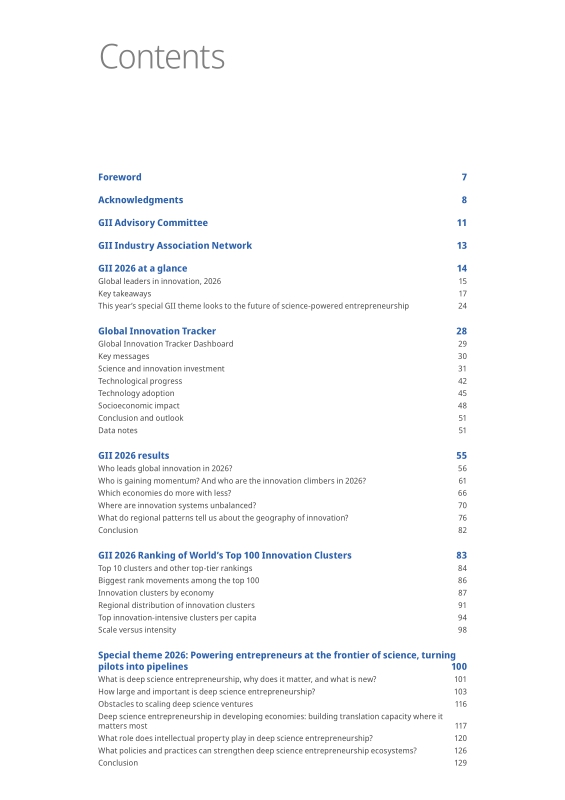
Contents 4
Foreword 6
Acknowledgments 7
GII Advisory Committee 10
GII Industry Association Network 12
GII 2026 at a glance 13
Global leaders in innovation, 2026 14
Key takeaways 16
This year's special GII theme looks to the future of science-powered entrepreneurship 23
Global Innovation Tracker 27
Global Innovation Tracker Dashboard 28
Key messages 29
Science and innovation investment 30
Technological progress 41
Technology adoption 44
Socioeconomic impact 47
Conclusion and outlook 50
Data notes 50
References 52
GII 2026 results 54
Who leads global innovation in 2026? 55
Who is gaining momentum? And who are the innovation climbers in 2026? 60
Which economies do more with less? 65
Where are innovation systems unbalanced? 69
What do regional patterns tell us about the geography of innovation? 75
Conclusion 81
GII 2026 Ranking of World's Top 100 Innovation Clusters 82
Top 10 clusters and other top-tier rankings 83
Biggest rank movements among the top 100 85
Innovation clusters by economy 86
Regional distribution of innovation clusters 90
Top innovation-intensive clusters per capita 93
Scale versus intensity 97
Special theme 2026: Powering entrepreneurs at the frontier of science, turning pilots into pipelines 99
What is deep science entrepreneurship, why does it matter, and what is new? 100
How large and important is deep science entrepreneurship? 102
Obstacles to scaling deep science ventures 115
Deep science entrepreneurship in developing economies: building translation capacity where it matters most 116
What role does intellectual property play in deep science entrepreneurship? 119
What policies and practices can strengthen deep science entrepreneurship ecosystems? 125
Conclusion 128
References 129
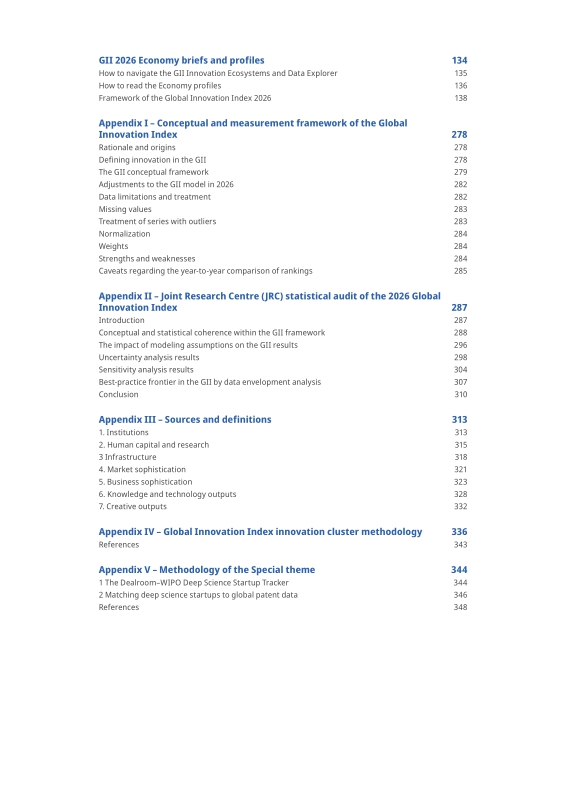
GII 2026 Economy briefs and profiles 133
How to navigate the GII 2026 Innovation Ecosystems and Data Explorer 134
How to read the Economy profiles 135
Framework of the Global Innovation Index 2026 137
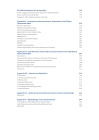
Appendix I - Conceptual and measurement framework of the Global Innovation Index 277
Rationale and origins 277
Defining innovation in the GII 277
The GII conceptual framework 278
Adjustments to the GII model in 2026 281
Data limitations and treatment 281
Missing values 282
Treatment of series with outliers 282
Normalization 283
Weights 283
Strengths and weaknesses 283
Caveats regarding the year-to-year comparison of rankings 284
References 285
Appendix II - Joint Research Centre (JRC) statistical audit of the 2026 Global Innovation Index 286
Introduction 286
Conceptual and statistical coherence within the GII framework 287
The impact of modeling assumptions on the GII results 295
Uncertainty analysis results 297
Sensitivity analysis results 303
Best-practice frontier in the GII by data envelopment analysis 306
Conclusion 309
References 310
Appendix III - Sources and definitions 312
1. Institutions 312
2. Human capital and research 314
3. Infrastructure 317
4. Market sophistication 320
5. Business sophistication 322
6. Knowledge and technology outputs 327
7. Creative outputs 331
Appendix IV - Global Innovation Index innovation cluster methodology 335
References 342
Appendix V - Methodology of the Special theme 343
1. The Dealroom-WIPO Deep Science Startup Tracker 343
2. Matching deep science startups to global patent data 345
References 347
Global Innovation Tracker 30
Figure 1. Science and technology publication growth, 2016-2025 30
Figure 2. GDP growth and total and business R&D growth rates, 2016-2026 31
Figure 3. Global R&D in USD trillion and as % of GDP, 1995-2025 31
Figure 4. R&D investment trends, by industry, 2015-2025 32
Figure 5. Top R&D spenders, by industry, growth rate 2024-2025, million USD 34
Figure 6. Global venture capital deal count and value, 2015-2026 38
Figure 7. Global top 20 non-AI venture capital deals, million USD, 2025 39
Figure 8. Equivalent population of annual energy usage by the top 100 supercomputers, 2015, 2021, 2024 and 2025 42
Figure 9. Levelized cost of electricity for selected technologies (2024 USD/kWh), 2010-2024 42
Figure 10. Global novel active substances launches, therapeutic areas, 2025 43
Figure 11. Population coverage of 5G network by income group, 2020-2025 44
Figure 12. Share of electric cars in total passenger car fleet, 2025 46
Figure 13. Global high-speed rail network length, 1980-2024 47
Figure 14. Output per employee and growth in output per hour, 2015-2025 48
Figure 15. Life expectancy and health gap, 2000-2021 49
GII 2026 results 56
Figure 1. The GII innovation leaders, 2021-2026 56
Figure 2. Economies soaring to new heights in innovation, 2026 58
Figure 3. Economies climbing the global innovation ladder, since 2013 and since 2019 61
Figure 4. Innovation overperformers, relative to economic development 66
Figure 5. Innovation input to output performance, by economy, 2026 69
Figure 6. Average regional performance across the seven GII pillars, 2026 75
GII 2026 Ranking of World's Top 100 Innovation Clusters 84
Figure 1. Global share of publications, PCT filings, and venture capital deals for the top 10 innovation clusters, 2026 84
Figure 2. Number of top 100 innovation clusters, economies and world regions where each organization registers patent or publication activity, 2026 88
Figure 3. Economies with two or more top 100 innovation clusters, 2026 89
Figure 4. Top 15 innovation intensive clusters, by metric per capita, 2026 95
Figure 5. Scale versus intensity in the world's top 100 innovation clusters, 2026 97
Figure 6. Top 15 innovation clusters with greatest differences between global rank and intensity rank, 2026 98
Special theme 2026: Powering entrepreneurs at the frontier of science, turning pilots into pipelines 103
Figure 1. Cumulative number of deep science startups and spinouts by year of first VC backing, 2010-2025 103
Figure 2. Number of new deep science startups and spinouts by year of first VC backing, 2010-2025 103
Figure 3. Top 20 economies, deep science growth, 2020-2025 105
Figure 4. Combined enterprise value of deep science startups and spinouts by founding cohort, 2020-2025 106
Figure 5. Deep science startups by sector: share by year of first VC backing, 2010-2025 107
Figure 6. Share of deep science spinouts in total deep science ventures founded since 2010 113
Figure 7. Trend over time in the share of patent-holding startups: deep vs. non-deep science startups, 2010-2025 120
Figure 8. Share of patent-holding deep science startups by economy, 2010-2025 121
Figure 9. Cumulative number of published international patent families filed by deep science startups founded 2010-2025, by sector 122
Figure 10. Share of patent-holding startups across growth stages: deep vs. non-deep science startups, 2010-2025 123
Figure 11. Top five deep science startups by region, ranked by number of simple patent families, 2010-2025 125
Boxes 33
Global Innovation Tracker 33
Box 1. Aerospace and defense 33
Box 2. Unicorns 39
GII 2026 results 57
Box 1. How to use the Global Innovation Index for better innovation metrics and policy 57
Box 2. Narrowing the gap: middle-income innovation pathways 62
Box 3. Where are companies investing in R&D and high-tech? Insights from FDI announcements 73
GII 2026 Ranking of World's Top 100 Innovation Clusters 84
Box 1. Top 10 innovation clusters by patents, publications or VC deals 84
Special theme 2026: Powering entrepreneurs at the frontier of science, turning pilots into pipelines 101
Box 1. The unique features of deep science entrepreneurship? 101
Box 2. Policy priorities for deep science entrepreneurship ecosystems 128
GII 2026 results 74
Box Figure 3.1. Green-field R&D and high-tech FDI projects: inflows versus outflows, 2025 74
GII 2026 Ranking of World's Top 100 Innovation Clusters 85
Box Figure 1.1. Top 10 clusters per metric highlighted against full distribution, 2026 85
Maps 83
Map 1. Top 100 innovation clusters worldwide, 2026 83
Map 2. Top innovation clusters by region, 2026 90
Appendix II Figure 1. Robustness analysis of the GII, Input and Output Sub-Indices 298
Appendix II Figure 2. GII 2026 scores and DEA "distance to the best-practice frontier" scores 309
Appendix Boxes 279
Appendix I - Conceptual and measurement framework of the Global Innovation Index 279
Appendix Box 1. GII origins, development and GII data infrastructure 279
Appendix II - Joint Research Centre (JRC) statistical audit of the 2026 Global Innovation Index 287
Box 1. Conceptual and statistical coherence in the GII 2026 framework 287
*표시는 필수 입력사항입니다.
| 전화번호 |
|---|
| 기사명 | 저자명 | 페이지 | 원문 | 기사목차 |
|---|
| 번호 | 발행일자 | 권호명 | 제본정보 | 자료실 | 원문 | 신청 페이지 |
|---|
도서위치안내: / 서가번호:

우편복사 목록담기를 완료하였습니다.
*표시는 필수 입력사항입니다.
저장 되었습니다.
