대표어
 https://www.oecd.org/en/publications/mapping-skill-shortages-in-oecd-countries_735f9485-en.html
권호기사보기
| 기사명 | 저자명 | 페이지 | 원문 | 기사목차 |
|---|
결과 내 검색
동의어 포함
Title page 1
Contents 8
Foreword 4
Abbreviations and acronyms 5
Executive summary 6
1. Introduction 10
1.1. Causes and consequences of skill imbalances 11
1.2. Definitions and measures of skill imbalances 12
2. Methodological considerations 16
2.1. Indicators of occupational imbalances 17
2.1.1. Wages 18
2.1.2. Employment 19
2.1.3. Unemployment rate 19
2.1.4. Hours worked 19
2.1.5. Vacancies 19
2.1.6. Underqualification 20
2.2. Method behind the Skills for Jobs Indicator 22
2.2.1. Step 1: Computing occupational imbalances 22
2.2.2. Step 2: Translating occupation shortages into skill shortages 25
3. Occupational imbalances, skill shortages and policy implications 27
3.1. Occupational imbalances 28
3.1.1. Occupational imbalances over time 32
3.1.2. Occupational imbalances at the industry level 38
3.2. Knowledge, abilities and skill shortages 40
3.2.1. Knowledge shortages 40
3.2.2. Ability shortages 42
3.2.3. Skill shortages 43
3.3. Policy implications 45
References 49
Annex A. Supporting material 62
Notes 80
Figure 2.1. Labour market signals underlying the Skills for Jobs Indicator 18
Figure 3.1. Key industries face significant shortages 39
Figure 3.2. Growth in OJP and wage point to shortages for occupations in the accommodation and food services industry, while hours worked and... 40
Figure 3.3. Knowledge areas associated with high-skilled occupations are generally in shortage 41
Figure 3.4. Cognitive abilities are in shortage, while physical and psychomotor abilities are in balance 42
Figure 3.5. Essential, social and system skills are in shortage, while remaining skills are closer to balance 44
Figure 3.6. Low representation of women among ICT professionals and technicians 46
Figure 3.7. Low representation of men and younger workers among health professionals and health associate professionals 47
Figure 3.8. Teaching professionals include relatively few men and younger workers 48
Boxes 13
Box 1.1. The evolution of the concept of skills in economics 13
Box 1.2. Terminology 15
Box 2.1. Approaches to measuring imbalances 17
Box 2.2. COVID-19 impact on labour market indicators 21
Box 2.3. Definitions of the signals underlying the occupational imbalance indicator 23
Box 2.4. O*NET occupation profiles and their use for the Skills for Jobs Indicator 25
Box 3.1. Policy recommendations for occupations facing the greatest shortages in OECD Member countries 46
*표시는 필수 입력사항입니다.
| 전화번호 |
|---|
| 기사명 | 저자명 | 페이지 | 원문 | 기사목차 |
|---|
| 번호 | 발행일자 | 권호명 | 제본정보 | 자료실 | 원문 | 신청 페이지 |
|---|
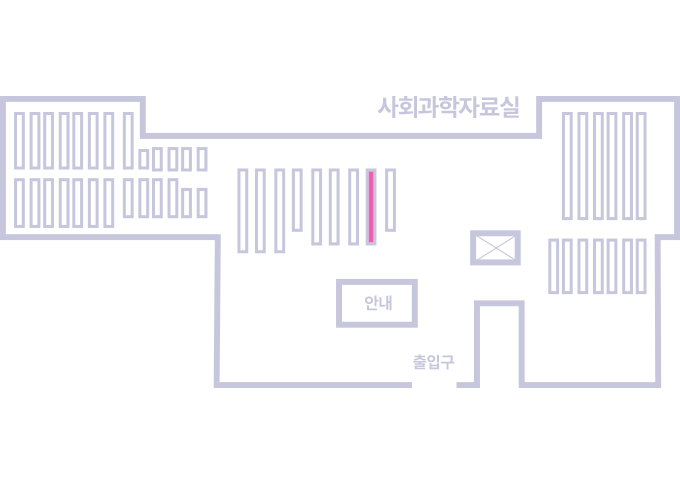
도서위치안내: / 서가번호:
우편복사 목록담기를 완료하였습니다.
*표시는 필수 입력사항입니다.
저장 되었습니다.