대표어
 https://www.oecd.org/en/publications/the-geography-of-choice_a5e46a1f-en.html
권호기사보기
| 기사명 | 저자명 | 페이지 | 원문 | 기사목차 |
|---|
결과 내 검색
동의어 포함
Title page 1
Contents 8
Foreword 4
Acknowledgements 6
Abbreviations and acronyms 11
Executive summary 13
1. Introduction 15
References 17
2. Approaches to define rural daily systems 19
Ideal criteria for a typology defining (rural) daily systems 20
Evaluation of existing OECD typologies 21
Comprehensive definitions of daily systems 23
Daily system definitions using mobile phone data 26
References 27
Notes 28
3. Comparing rural daily systems 30
FRAs are not exclusively rural, and not all rural areas are in FRAs 31
Many people live and work in the same FRA, but some FRAs have strong commuting links with FUAs 32
Comparing FRAs with other daily system delineations 37
Key findings from the comparison of daily systems 44
References 45
4. Assessing rural daily systems with mobile phone data 47
Different types of mobile phone data 48
Assessment criteria 58
Results 59
References 63
5. Territorial trends across daily systems 64
Classification of functional areas by settlement size 65
Territorial patterns across the urban-rural continuum 67
References 78
Notes 78
6. Conclusions 80
Annex A. Labour Market Area delineations 84
Annex B. Additional figures and tables 85
Annex C. KOTI mobile phone data preprocessing 88
Annex D. Cosine similarity between GPS-based and census-based commuting flows 89
Figure 3.1. Population in FRAs is split between rural local areas and towns / semi-dense local areas 31
Figure 3.2. A sizeable share of people in FUAs live in rural local areas 32
Figure 3.3. Many people live and work in the same FRA, although the share is often lower than in FUAs 33
Figure 3.4. FRAs vary in whether they have a strong commuting link to a single other functional area 34
Figure 3.5. Example of a FRA where more working residents commute to the Hamburg FUA than work within the FRA itself (Hemmoor, Germany) 35
Figure 3.6. Commuting outflows from FRAs often goes to FUAs 36
Figure 3.7. Self-containment distributions are similar for LMAs and FRAs + FUAs in France 41
Figure 3.8. French LMAs, FRAs + FUAs and Bassins de Vie outperform random benchmarks on most labour market measures 43
Figure 4.1. KOTI mobile phone data show a very high territorial coverage across all types of settlements 49
Figure 4.2. Work trips and the resident population are similarly distributed across settlements 49
Figure 4.3. Trips in rural areas are less work-related than in other types of settlements 51
Figure 4.4. Rural areas outside commuting zones are self-contained labour markets but rely more on cities for services 52
Figure 4.5. Regular trip distances are highest in rural areas 52
Figure 4.6. Data quality differs across settlement types 55
Figure 4.7. Distributions of trip types vary slightly between countries, exhibiting an unexpected within-country consistency across settlement types 57
Figure 4.8. Average trip distances differ widely across countries and settlement types 58
Figure 4.9. Comparing metrics for different types of trips in Korea 60
Figure 4.10. Comparing different daily system typologies in Japan for autonomy and cohesion 61
Figure 4.11. Comparing different daily system typologies in Japan for homogeneity 61
Figure 4.12. Comparing different daily system typologies in Australia for autonomy and cohesion 62
Figure 4.13. Comparing different daily system typologies in Australia for homogeneity 62
Figure 5.1. Most functional areas across the OECD are classified as rural 66
Figure 5.2. Most OECD population lives in urban, not rural, functional areas 67
Figure 5.3. Old-age dependency is highest in most rural FRAs 68
Figure 5.4. The most rural FRAs have the lowest foreign-born population share 69
Figure 5.5. Built up areas kept growing even in declining FRA's 69
Figure 5.6. Urban areas show higher dwelling occupancy, but rural patterns vary 70
Figure 5.7. Rents are higher in urban areas, lower in rural areas 71
Figure 5.8. Rent and dwelling occupancy are closely linked 72
Figure 5.9. Hospital access within 45 minutes declines sharply with rurality 73
Figure 5.10. Spain's interior faces far greater hospital access gaps than Portugal 74
Figure 5.11. Internet speeds decline sharply with rurality 75
Figure 5.12. Per-capita emissions are far higher in rural areas, reflecting where production is located 76
Figure 5.13. Emissions have fallen furthest in the most rural areas, driven by the power sector 77
Boxes 10
Box 2.1. Functional urban areas 21
Box 3.1. Quantitative measures to assess daily systems 38
Box 3.2. Comparing delineations requires accounting for the number and size of daily systems 39
Box 3.3. Explaining changes in minimum self-containment 41
Box 3.4. An algorithm to create random daily-system delineations as a benchmark 42
Figure A B.1. Most FUAs have no large commuting outflow to a single other functional area, but some show strong links 85
Figure A D.1. In Australia, GPS-based and census-based commuting flows are consistent 89
Figure A D.2. Although sparse, Canadian GPS-based commuting flows are relatively consistent with census-based flows, especially in cities 90
Figure A D.3. In Japan, GPS-based and census-based commuting flows are consistent 91
Figure A D.4. In the UK, GPS-based and census-based commuting flows are consistent 92
*표시는 필수 입력사항입니다.
| 전화번호 |
|---|
| 기사명 | 저자명 | 페이지 | 원문 | 기사목차 |
|---|
| 번호 | 발행일자 | 권호명 | 제본정보 | 자료실 | 원문 | 신청 페이지 |
|---|
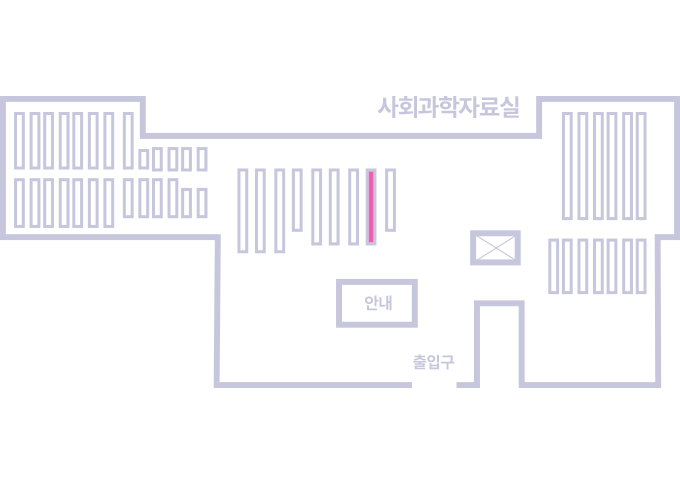
도서위치안내: / 서가번호:
우편복사 목록담기를 완료하였습니다.
*표시는 필수 입력사항입니다.
저장 되었습니다.