대표어
 https://www.oecd.org/en/publications/agricultural-policy-monitoring-and-evaluation-2026_2c7f3be1-en.html
권호기사보기
| 기사명 | 저자명 | 페이지 | 원문 | 기사목차 |
|---|
결과 내 검색
동의어 포함
Title page 1
Contents 7
Foreword 4
Acknowledgements 5
Acronyms and Abbreviations 19
Executive Summary 22
1. Public support for farmers and consumers 26
Global drivers of agricultural policies in 2025-26 28
Overview of the evolution of support to agriculture 33
Conclusions 51
References 53
Annex 1.A. Definition of OECD indicators of agricultural support 55
Annex 1.B. Estimates of support to agriculture: Regional aggregates 61
2. Developments in agricultural policies and support by country 64
Policies and responses to events in 2025-26 65
Support levels and trends by country 77
Conclusions 86
Note 88
Country chapters 89
3. Argentina 90
Main findings 90
Policy landscape 96
Recent policy developments 98
Policy context 99
References 107
Notes 107
4. Australia 108
Main findings 108
Policy landscape 114
Recent policy developments 116
Policy context 119
References 126
Notes 127
5. Brazil 128
Main findings 128
Policy landscape 135
Recent policy developments 136
Policy context 138
References 146
6. Canada 147
Main findings 147
Policy landscape 153
Recent policy developments 156
Policy context 159
References 166
Note 167
7. Chile 168
Main findings 168
Policy landscape 175
Recent policy developments 176
Policy context 177
References 184
8. China 185
Main findings 185
Policy landscape 191
Recent policy developments 192
Policy context 197
References 206
Notes 206
9. Colombia 207
Main findings 207
Policy landscape 214
Recent policy developments 215
Policy context 216
References 224
Notes 224
10. Costa Rica 225
Main findings 225
Policy landscape 231
Recent policy developments 233
Policy context 235
References 243
Note 243
11. Egypt 244
Main findings 244
Policy landscape 251
Recent policy developments 252
Policy context 253
References 261
12. European Union 263
Main findings 263
Policy landscape 271
Recent policy developments 278
Country snapshots 281
Policy context 309
References 318
Notes 321
13. Iceland 322
Main findings 322
Policy landscape 329
Recent policy developments 330
Policy context 331
References 338
14. India 339
Main findings 339
Policy landscape 345
Recent policy developments 347
Policy context 351
References 360
Notes 361
15. Indonesia 362
Main findings 362
Policy landscape 369
Recent policy developments 372
Policy context 374
References 380
16. Israel 381
Main findings 381
Policy landscape 388
Recent policy developments 389
Policy context 392
References 399
Notes 399
17. Japan 400
Main findings 400
Policy landscape 407
Recent policy developments 409
Policy context 411
References 420
Notes 420
18. Kazakhstan 421
Main findings 421
Policy landscape 428
Recent policy developments 429
Policy context 431
Reference 438
19. Korea 439
Main findings 439
Policy landscape 445
Recent policy developments 446
Policy context 448
Reference 456
Note 456
20. Mexico 457
Main findings 457
Policy landscape 465
Recent policy developments 466
Policy context 468
21. New Zealand 475
Main findings 475
Policy landscape 482
Recent policy developments 485
Policy context 487
References 493
Notes 493
22. Norway 495
Main findings 495
Policy landscape 502
Recent policy developments 503
Policy context 505
References 511
23. Peru 512
Main findings 512
Policy landscape 519
Recent policy developments 520
Policy context 521
Note 528
24. Philippines 529
Main findings 529
Policy landscape 536
Recent policy developments 536
Policy context 541
References 549
Note 551
25. South Africa 552
Main findings 552
Policy landscape 559
Recent policy developments 561
Policy context 563
References 569
Notes 570
26. Switzerland 571
Main findings 571
Policy landscape 579
Recent policy developments 582
Policy context 584
References 592
Notes 592
27. Türkiye 593
Main findings 593
Policy landscape 601
Recent policy developments 603
Policy context 606
References 613
28. Ukraine 614
Main findings 614
Key indicators on agricultural support 616
Policy landscape 621
Recent policy developments 623
Policy context 625
References 633
Notes 633
29. United Kingdom 634
Main findings 634
Policy landscape 641
Recent policy developments 644
Policy context 647
References 653
30. United States 654
Main findings 654
Policy landscape 661
Recent policy developments 662
Policy context 665
References 673
Notes 674
31. Viet Nam 675
Main findings 675
Policy landscape 681
Recent policy developments 682
Policy context 685
References 692
Note 692
Annex A. Sources and Definitions of Contextual Indicators 693
Figure 1.1. Inflation restarting in 2026 after stable 2025, dairy prices showing volatility 29
Figure 1.2. Support to fertiliser tracks the price of urea 30
Figure 1.3. Structure of agricultural support indicators 35
Figure 1.4. Total support to agriculture jumped in 2025 37
Figure 1.5. China and India account for a large and growing share of agricultural support 39
Figure 1.6. The composition of support to farmers has shifted toward budgetary payments in the OECD, while MPS continues to dominate... 40
Figure 1.7. Net market transfers to farmers have increased since 2022, following a long-term decline 42
Figure 1.8. Most support is unconstrained, while conditionality is concentrated in specific policy instruments 44
Figure 1.9. Support varies widely across commodities, with highest levels for sugar, maize and rapeseed 46
Figure 1.10. Consumers face a mix of policies that either support or implicitly tax them 48
Figure 1.11. Infrastructure dominates general services support, while public stockholding plays a larger role in emerging economies 50
Figure 2.1. Support affecting farmers varied between -13% and 52% of gross farm receipts 79
Figure 2.2. Infrastructure and AKIS are the largest components of general support in most countries 80
Figure 2.3. With a few exceptions, most countries' consumers are implicitly taxed by agricultural policies 81
Figure 2.4. Potentially most distorting transfers in different countries range from less than 0.2% to 39% of farm receipts 83
Figure 2.5. In most countries, MPS varies significantly across commodities 84
Figure 2.6. Norway and Switzerland provide the highest shares of less production-linked support in gross farm receipts 86
Figure 3.1. Argentina: Development of support to agriculture 92
Figure 3.2. Argentina: Commodity-specific transfers (SCT), 2023-25 94
Figure 3.3. Argentina: Main economic indicators, 2000 to 2025 101
Figure 3.4. Argentina: Agro-food trade 102
Figure 3.5. Argentina: Composition of agricultural output growth, 2014-23 103
Figure 3.6. Argentina: Development of the PSE and its composition, 1997 to 2025 106
Figure 4.1. Australia: Development of support to agriculture 110
Figure 4.2. Australia: Commodity-specific transfers (SCT), 2023-25 112
Figure 4.3. Australia: Main economic indicators, 2000 to 2025 121
Figure 4.4. Australia: Agro-food trade 122
Figure 4.5. Australia: Composition of agricultural output growth, 2014-23 123
Figure 4.6. Australia: Development of the PSE and its composition, 1986 to 2025 125
Figure 5.1. Brazil: Development of support to agriculture 130
Figure 5.2. Brazil: Drivers of the change in PSE, 2024 to 2025 132
Figure 5.3. Brazil: Commodity-specific transfers (SCT), 2023-25 133
Figure 5.4. Brazil: Main economic indicators, 2000 to 2025 140
Figure 5.5. Brazil: Agro-food trade 141
Figure 5.6. Brazil: Composition of agricultural output growth, 2014-23 142
Figure 5.7. Brazil: Development of the PSE and its composition, 1995 to 2025 146
Figure 6.1. Canada: Development of support to agriculture 149
Figure 6.2. Canada: Drivers of the change in PSE, 2024 to 2025 151
Figure 6.3. Canada: Commodity-specific transfers (SCT), 2023-25 151
Figure 6.4. Canada: Main economic indicators, 2000 to 2025 161
Figure 6.5. Canada: Agro-food trade 162
Figure 6.6. Canada: Composition of agricultural output growth, 2014-23 163
Figure 6.7. Canada: Development of the PSE and its composition, 1986 to 2025 166
Figure 7.1. Chile: Development of support to agriculture 170
Figure 7.2. Chile: Drivers of the change in PSE, 2024 to 2025 172
Figure 7.3. Chile: Commodity-specific transfers (SCT), 2023-25 173
Figure 7.4. Chile: Main economic indicators, 2000 to 2025 179
Figure 7.5. Chile: Agro-food trade 180
Figure 7.6. Chile: Composition of agricultural output growth, 2014-23 181
Figure 7.7. Chile: Development of the PSE and its composition, 1990 to 2025 184
Figure 8.1. China: Development of support to agriculture 187
Figure 8.2. China: Drivers of the change in PSE, 2024 to 2025 189
Figure 8.3. China: Commodity-specific transfers (SCT), 2023-25 189
Figure 8.4. China: Main economic indicators, 2000 to 2025 199
Figure 8.5. China: Agro-food trade 200
Figure 8.6. China: Composition of agricultural output growth, 2014-23 201
Figure 8.7. China: Development of the PSE and its composition, 1993 to 2025 205
Figure 9.1. Colombia: Development of support to agriculture 209
Figure 9.2. Colombia: Drivers of the change in PSE, 2024 to 2025 211
Figure 9.3. Colombia: Commodity-specific transfers (SCT), 2023-25 212
Figure 9.4. Colombia: Main economic indicators, 2000 to 2025 218
Figure 9.5. Colombia: Agro-food trade 219
Figure 9.6. Colombia: Composition of agricultural output growth, 2014-23 220
Figure 9.7. Colombia: Development of the PSE and its composition, 1992 to 2025 223
Figure 10.1. Costa Rica: Development of support to agriculture 227
Figure 10.2. Costa Rica: Drivers of the change in PSE, 2024 to 2025 229
Figure 10.3. Costa Rica: Commodity-specific transfers (SCT), 2023-25 229
Figure 10.4. Costa Rica: Main economic indicators, 2000 to 2025 237
Figure 10.5. Costa Rica: Agro-food trade 238
Figure 10.6. Costa Rica: Composition of agricultural output growth, 2014-23 239
Figure 10.7. Costa Rica: Development of the PSE and its composition, 1995 to 2025 242
Figure 11.1. Egypt: Development of support to agriculture 246
Figure 11.2. Egypt: Drivers of the change in PSE, 2024 to 2025 248
Figure 11.3. Egypt: Commodity-specific transfers (SCT), 2023-25 249
Figure 11.4. Egypt: Main economic indicators, 2000 to 2025 255
Figure 11.5. Egypt: Agro-food trade 256
Figure 11.6. Egypt: Composition of agricultural output growth, 2014-23 257
Figure 11.7. Egypt: Development of the PSE and its composition, 2000 to 2025 260
Figure 12.1. European Union: Development of support to agriculture 266
Figure 12.2. European Union: Drivers of the change in PSE, 2024 to 2025 268
Figure 12.3. European Union: Commodity-specific transfers (SCT), 2023-25 269
Figure 12.4. Share of the CSP budget targeting specific commodities and sectors 277
Figure 12.5. European Union: Main economic indicators, 2000 to 2025 310
Figure 12.6. European Union: Agro-food trade 311
Figure 12.7. European Union: Composition of agricultural output growth, 2014-23 312
Figure 12.8. European Union: Development of the PSE and its composition, 1986 to 2025 317
Figure 13.1. Iceland: Development of support to agriculture 324
Figure 13.2. Iceland: Drivers of the change in PSE, 2024 to 2025 326
Figure 13.3. Iceland: Commodity-specific transfers (SCT), 2023-25 327
Figure 13.4. Iceland: Main economic indicators, 2000 to 2025 333
Figure 13.5. Iceland: Agro-food trade 334
Figure 13.6. Iceland: Composition of agricultural output growth, 2014-23 335
Figure 13.7. Iceland: Development of the PSE and its composition, 1986 to 2025 337
Figure 14.1. India: Development of support to agriculture 341
Figure 14.2. India: Commodity-specific transfers (SCT), 2023-25 343
Figure 14.3. India: Main economic indicators, 2000 to 2025 353
Figure 14.4. India: Agro-food trade 354
Figure 14.5. India: Composition of agricultural output growth, 2014-23 355
Figure 14.6. India: Development of the PSE and its composition, 2000 to 2025 360
Figure 15.1. Indonesia: Development of support to agriculture 364
Figure 15.2. Indonesia: Drivers of the change in PSE, 2024 to 2025 366
Figure 15.3. Indonesia: Commodity-specific transfers (SCT), 2023-25 367
Figure 15.4. Indonesia: Main economic indicators, 2000 to 2025 375
Figure 15.5. Indonesia: Agro-food trade 376
Figure 15.6. Indonesia: Composition of agricultural output growth, 2014-23 377
Figure 15.7. Indonesia: Development of the PSE and its composition, 1990 to 2025 380
Figure 16.1. Israel: Development of support to agriculture 383
Figure 16.2. Israel: Drivers of the change in PSE, 2024 to 2025 385
Figure 16.3. Israel: Commodity-specific transfers (SCT), 2023-25 386
Figure 16.4. Israel: Main economic indicators, 2000 to 2025 393
Figure 16.5. Israel: Agro-food trade 394
Figure 16.6. Israel: Composition of agricultural output growth, 2014-23 395
Figure 16.7. Israel: Development of the PSE and its composition, 1995 to 2025 398
Figure 17.1. Japan: Development of support to agriculture 402
Figure 17.2. Japan: Drivers of the change in PSE, 2024 to 2025 404
Figure 17.3. Japan: Commodity-specific transfers (SCT), 2023-25 405
Figure 17.4. Japan: Main economic indicators, 2000 to 2025 413
Figure 17.5. Japan: Agro-food trade 414
Figure 17.6. Japan: Composition of agricultural output growth, 2014-23 416
Figure 17.7. Japan: Development of the PSE and its composition, 1986 to 2025 419
Figure 18.1. Kazakhstan: Development of support to agriculture 423
Figure 18.2. Kazakhstan: Drivers of the change in PSE, 2024 to 2025 425
Figure 18.3. Kazakhstan: Commodity-specific transfers (SCT), 2023-25 426
Figure 18.4. Kazakhstan: Main economic indicators, 2000 to 2025 433
Figure 18.5. Kazakhstan: Agro-food trade 434
Figure 18.6. Kazakhstan: Composition of agricultural output growth, 2014-23 435
Figure 18.7. Kazakhstan: Development of the PSE and its composition, 1995 to 2025 438
Figure 19.1. Korea: Development of support to agriculture 441
Figure 19.2. Korea: Drivers of the change in PSE, 2024 to 2025 443
Figure 19.3. Korea: Commodity-specific transfers (SCT), 2023-25 443
Figure 19.4. Korea: Main economic indicators, 2000 to 2025 450
Figure 19.5. Korea: Agro-food trade 451
Figure 19.6. Korea: Composition of agricultural output growth, 2014-23 452
Figure 19.7. Korea: Development of the PSE and its composition, 1986 to 2025 455
Figure 20.1. Mexico: Development of support to agriculture 459
Figure 20.2. Mexico: Drivers of the change in PSE, 2024 to 2025 462
Figure 20.3. Mexico: Commodity-specific transfers (SCT), 2023-25 463
Figure 20.4. Mexico: Main economic indicators, 2000 to 2025 469
Figure 20.5. Mexico: Agro-food trade 470
Figure 20.6. Mexico: Composition of agricultural output growth, 2014-23 471
Figure 20.7. Mexico: Development of the PSE and its composition, 1986 to 2025 474
Figure 21.1. New Zealand: Development of support to agriculture 477
Figure 21.2. New Zealand: Drivers of the change in PSE, 2024 to 2025 479
Figure 21.3. New Zealand: Commodity-specific transfers (SCT), 2023-25 480
Figure 21.4. New Zealand: Main economic indicators, 2000 to 2025 488
Figure 21.5. New Zealand: Agro-food trade 489
Figure 21.6. New Zealand: Composition of agricultural output growth, 2014-23 490
Figure 21.7. New Zealand: Development of the PSE and its composition, 1986 to 2025 492
Figure 22.1. Norway: Development of support to agriculture 497
Figure 22.2. Norway: Drivers of the change in PSE, 2024 to 2025 499
Figure 22.3. Norway: Commodity-specific transfers (SCT), 2023-25 500
Figure 22.4. Norway: Main economic indicators, 2000 to 2025 506
Figure 22.5. Norway: Agro-food trade 507
Figure 22.6. Norway: Composition of agricultural output growth, 2014-23 508
Figure 22.7. Norway: Development of the PSE and its composition, 1986 to 2025 511
Figure 23.1. Peru: Development of support to agriculture 514
Figure 23.2. Peru: Drivers of the change in PSE, 2024 to 2025 516
Figure 23.3. Peru: Commodity-specific transfers (SCT), 2023-25 517
Figure 23.4. Peru: Main economic indicators, 2000 to 2025 523
Figure 23.5. Peru: Agro-food trade 524
Figure 23.6. Peru: Composition of agricultural output growth, 2014-23 525
Figure 23.7. Peru: Development of the PSE and its composition, 2000 to 2025 528
Figure 24.1. Philippines: Development of support to agriculture 531
Figure 24.2. Philippines: Drivers of the change in PSE, 2024 to 2025 533
Figure 24.3. Philippines: Commodity-specific transfers (SCT), 2023-25 534
Figure 24.4. Philippines: Main economic indicators, 2000 to 2025 543
Figure 24.5. Philippines: Agro-food trade 544
Figure 24.6. Philippines: Composition of agricultural output growth, 2014-23 545
Figure 24.7. Philippines: Development of the PSE and its composition, 2000 to 2025 548
Figure 25.1. South Africa: Development of support to agriculture 554
Figure 25.2. South Africa: Drivers of the change in PSE, 2024 to 2025 556
Figure 25.3. South Africa: Commodity-specific transfers (SCT), 2023-25 557
Figure 25.4. South Africa: Main economic indicators, 2000 to 2025 564
Figure 25.5. South Africa: Agro-food trade 565
Figure 25.6. South Africa: Composition of agricultural output growth, 2014-23 566
Figure 25.7. South Africa: Development of the PSE and its composition, 1994 to 2025 568
Figure 26.1. Switzerland: Development of support to agriculture 573
Figure 26.2. Switzerland: Drivers of the change in PSE, 2024 to 2025 576
Figure 26.3. Switzerland: Commodity-specific transfers (SCT), 2023-25 577
Figure 26.4. Switzerland: Main economic indicators, 2000 to 2025 586
Figure 26.5. Switzerland: Agro-food trade 587
Figure 26.6. Switzerland: Composition of agricultural output growth, 2014-23 588
Figure 26.7. Switzerland: Development of the PSE and its composition, 1986 to 2025 591
Figure 27.1. Türkiye: Development of support to agriculture 595
Figure 27.2. Türkiye: Drivers of the change in PSE, 2024 to 2025 598
Figure 27.3. Türkiye: Commodity-specific transfers (SCT), 2023-25 599
Figure 27.4. Türkiye: Main economic indicators, 2000 to 2025 607
Figure 27.5. Türkiye: Agro-food trade 608
Figure 27.6. Türkiye: Composition of agricultural output growth, 2014-23 609
Figure 27.7. Türkiye: Development of the PSE and its composition, 1986 to 2025 612
Figure 28.1. Ukraine: Development of support to agriculture 616
Figure 28.2. Ukraine: Drivers of the change in PSE, 2024 to 2025 618
Figure 28.3. Ukraine: Commodity-specific transfers (SCT), 2023-25 619
Figure 28.4. Ukraine: Main economic indicators, 2000 to 2025 627
Figure 28.5. Ukraine: Agro-food trade 628
Figure 28.6. Ukraine: Composition of agricultural output growth, 2014-23 629
Figure 28.7. Ukraine: Development of the PSE and its composition, 1995 to 2025 632
Figure 29.1. United Kingdom: Development of support to agriculture 636
Figure 29.2. United Kingdom: Drivers of the change in PSE, 2024 to 2025 638
Figure 29.3. United Kingdom: Commodity-specific transfers (SCT), 2023-25 639
Figure 29.4. United Kingdom: Main economic indicators, 2000 to 2025 648
Figure 29.5. United Kingdom: Agro-food trade 649
Figure 29.6. United Kingdom: Composition of agricultural output growth, 2014-23 650
Figure 29.7. United Kingdom: Development of the PSE and its composition, 2017 to 2025 652
Figure 30.1. United States: Development of support to agriculture 656
Figure 30.2. United States: Drivers of the change in PSE, 2024 to 2025 658
Figure 30.3. United States: Commodity-specific transfers (SCT), 2023-25 659
Figure 30.4. United States: Main economic indicators, 2000 to 2025 667
Figure 30.5. United States: Agro-food trade 668
Figure 30.6. United States: Composition of agricultural output growth, 2014-23 669
Figure 30.7. United States: Development of the PSE and its composition, 1986 to 2025 673
Figure 31.1. Viet Nam: Development of support to agriculture 677
Figure 31.2. Viet Nam: Commodity-specific transfers (SCT), 2023-25 679
Figure 31.3. Viet Nam: Main economic indicators, 2000 to 2025 685
Figure 31.4. Viet Nam: Agro-food trade 687
Figure 31.5. Viet Nam: Composition of agricultural output growth, 2014-23 688
Figure 31.6. Viet Nam: Development of the PSE and its composition, 2000 to 2025 691
Boxes 18
Box 1.1. Historical responses to changing fertiliser prices 29
Box 1.2. Expanding the country coverage: Egypt and Peru in the OECD Agricultural Policy Monitoring and Evaluation framework 33
Box 1.3. Budgetary components of the PSE 35
Box 1.4. OECD analysis and recommendations regarding policy support 37
Box 1.5. Understanding market price support 42
Box 1.6. Components of the Consumer Support Estimate 47
Box 2.1. What numbers moved the most in 2025? 78
Box 12.1. The European Commission's proposal for the CAP 2028-34 280
Annex Boxes 57
Annex Box 1.A.1. Definitions of categories in the PSE classification 57
*표시는 필수 입력사항입니다.
| 전화번호 |
|---|
| 기사명 | 저자명 | 페이지 | 원문 | 기사목차 |
|---|
| 번호 | 발행일자 | 권호명 | 제본정보 | 자료실 | 원문 | 신청 페이지 |
|---|
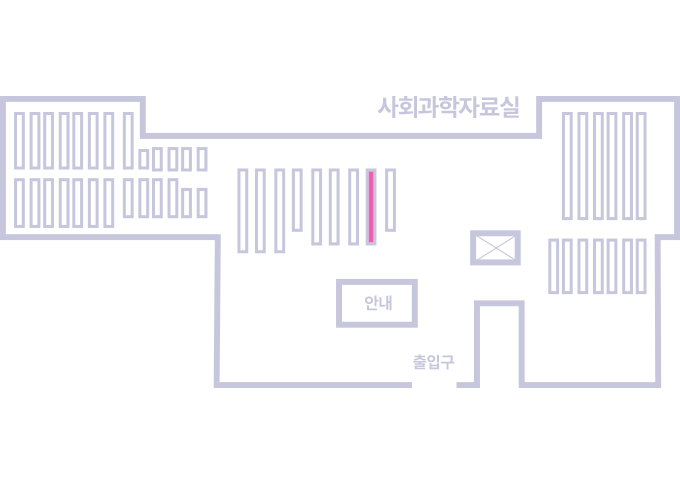
도서위치안내: / 서가번호:
우편복사 목록담기를 완료하였습니다.
*표시는 필수 입력사항입니다.
저장 되었습니다.