대표어
 https://www.oecd.org/en/publications/global-insurance-market-trends-2026_c8be6585-en.html
권호기사보기
| 기사명 | 저자명 | 페이지 | 원문 | 기사목차 |
|---|
결과 내 검색
동의어 포함
Title page 1
Contents 5
Foreword 4
Executive summary 7
1. Insurance penetration 9
1.1. The level of insurance penetration increased in 2025 in OECD countries and non-OECD reporting jurisdictions 10
1.2. Higher-income countries tend to have higher insurance penetration 11
1.3. Similar penetration levels reflect different mixes of life and non-life insurance 11
2. Premium growth and underwriting performance in the non-life insurance sector 13
2.1. Continued growth in non-life premiums 14
2.2. Pricing adjustments remained the main driver of non-life premium growth 15
2.3. Increased policy volumes also contributed to premium growth 16
2.4. Claims development reflected different loss experiences 17
2.5. Underwriting profitability masked diverse underlying dynamics 19
2.6. Insurer retention ratios increased despite cheaper reinsurance 20
3. Premium growth and underwriting performance in the life insurance sector 23
3.1. Life insurance markets recorded solid growth across most jurisdictions 24
3.2. Financial market conditions supported investment-linked products 25
3.3. Pension reforms and retirement saving supported growth in some markets 25
3.4. Lower surrender payments contributed to slower claims growth 25
4. Investment performance and portfolio allocations 28
4.1. Real investment returns declined across most jurisdictions 29
4.2. Bonds remained the dominant asset class 31
5. Profitability in the insurance sector 33
5.1. Overall profitability remained strong 34
5.2. Shareholder equity 35
6. Risks and vulnerabilities facing the insurance sector 37
6.1. The risk environment became more complex 38
6.2. Cyber risks 39
6.3. Catastrophe and climate risks 39
6.4. Geopolitical risks 41
References 42
Annex A. Statistical tables 44
Annex B. Methodological notes 54
Figure 1.1. Insurance penetration, in OECD countries and non-OECD reporting jurisdictions, 2015-2025 10
Figure 1.2. Life and non-life insurance penetration by income group, 2015-2025 11
Figure 1.3. Insurance penetration by jurisdiction, life and non-life breakdown, 2025 12
Figure 2.1. Annual growth rates of direct gross premiums written in the non-life sector in 2025 14
Figure 2.2. Nominal growth rate of home, health and motor vehicle insurance premium prices, selected countries, 2025 16
Figure 2.3. Annual growth rates of gross claims payments in the non-life sector in 2025 17
Figure 2.4. Combined ratio for the non-life sector in 2024 and 2025 19
Figure 2.5. Retention ratios in the non-life sector in 2024 and 2025 21
Figure 3.1. Annual growth rates of direct gross premiums written in the life sector in 2025 24
Figure 3.2. Annual growth rates of life gross claims payouts in 2025 26
Figure 4.1. Average real net investment rates of return by type of domestic insurer, 2025 30
Figure 4.2. Average asset allocation of domestic life, non-life and composite insurers among reporting jurisdictions, at end-2025 31
Figure 5.1. Return on equity by insurer type and jurisdiction, 2025 34
Figure 5.2. Change in shareholder equity by type of insurer, 2025 35
Figure 6.1. Risks and vulnerabilities identified by national authorities, percentage of respondents identifying the risk 38
Figure 6.2. Global insured natural catastrophe losses and insured share of total economic losses, 2000-2025 40
Boxes 18
Box 2.1. Motor vehicle insurance: The changing economics of vehicle repair 18
Box 4.1. Private credit: Balancing higher yields with higher risks 32
*표시는 필수 입력사항입니다.
| 전화번호 |
|---|
| 기사명 | 저자명 | 페이지 | 원문 | 기사목차 |
|---|
| 번호 | 발행일자 | 권호명 | 제본정보 | 자료실 | 원문 | 신청 페이지 |
|---|
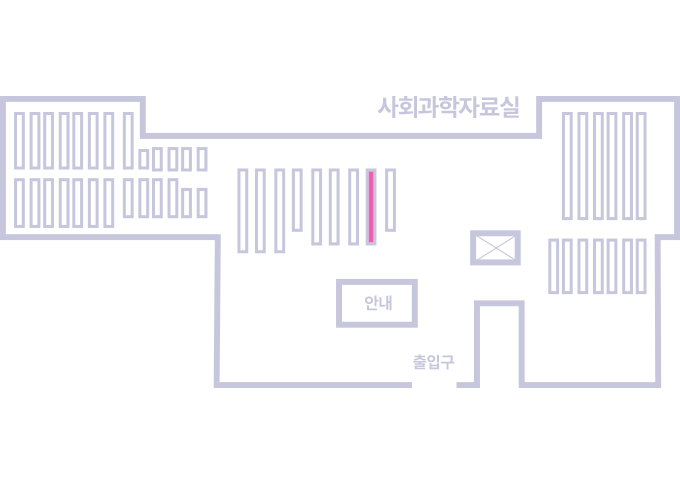
도서위치안내: / 서가번호:
우편복사 목록담기를 완료하였습니다.
*표시는 필수 입력사항입니다.
저장 되었습니다.