대표어
 https://www.ilo.org/publications/major-publications/women-business-and-management-scaling-success
권호기사보기
| 기사명 | 저자명 | 페이지 | 원문 | 기사목차 |
|---|
결과 내 검색
동의어 포함
Title page 1
Contents 14
Preface 4
Acknowledgements 6
Executive summary 8
Key insights 8
The business case for gender diversity continues to strengthen 8
Gender imbalances in the labour market persist, despite some improvements 9
Progress in the private sector is real but uneven 9
Policies, monitoring frameworks and voluntary targets make a measurable difference 10
Looking forward 11
Abbreviations and acronyms 12
1. Introduction 20
Gender equality and diversity in business: A strategic imperative at a turning point 23
A changing global context: Key drivers of transformation 23
Towards a transformative agenda for gender equality and diversity 24
About this report 24
Structure of the report 24
Methodological overview 25
2. Women in the labour market: Trends, gaps and outcomes 27
Labour force participation: Slow progress and structural constraints 29
Global overview 29
Regional variations 31
Labour market shocks and women's resilience 31
More women are now business owners or employers 32
More women than ever before participate in higher education 33
More women are in management but gender balance remains out of reach 34
Demographics and the imperative for talent acquisition 37
Digital and green transitions offer opportunities and risks 37
Women continue to earn less than men 38
What the evidence suggests 38
3. The business case for gender diversity 41
More businesses report improved outcomes from gender equality and diversity initiatives 43
Motivations behind gender equality and diversity initiatives 46
Most enterprises that promote women in management report increased profits 46
Women leaders improve business outcomes, with effects strengthening over time 48
Tackling gender gaps boosts economic growth 50
What the evidence suggests 50
4. Women in the private sector: Representation, progression and leadership gaps 53
Gender diversity in enterprises shows modest improvements 56
Steady progress in women's presence in management and leadership, but the leaky pipeline persists 56
Weak gender balance in junior and middle management puts senior talent pipelines at risk 59
More women are in business leadership, but women leaders are still the exception rather than the norm 62
The C-suite: Progress but still far from parity 62
Board composition: Progress towards critical thresholds, but gaps remain 63
Female board chairs are catalysts for gender diversity 64
Progress across functions and sectors, but barriers persist 66
What the evidence suggests 69
5. Enterprise initiatives that make the difference 72
Maternity leave, preventing and addressing violence and harassment, and equal pay initiatives are most effective 74
Gender equality and diversity policies are associated with improved business outcomes 76
Fewer enterprises implement gender equality and diversity initiatives 78
ESG both drives and is shaped by gender equality and diversity 81
ESG is widespread, associated with improved outcomes, and incorporates gender dimensions 82
Gender metrics and targets are associated with increased profits 85
ESG and gender diversity: A mutually reinforcing relationship 88
What the evidence suggests 88
6. Where next? 90
Annex 1. The enterprise survey on women in business and management 92
The survey sample 92
Enterprise characteristics 92
Respondent characteristics 95
Annex 2. Supplementary figures 96
Annex 3. Case studies 103
Case study 1: Centenary Bank, Uganda (banking) 103
Empowering women: a core value 103
Learning and development are key 103
Impact and plans for the future 104
Case study 2: HPS, Morocco (electronic payment solutions) 104
Drivers for action 105
Walking the talk 105
Meeting international standards 105
Impact and targets 106
Plans for the future 106
Case study 3: Airspeed, the Philippines (logistics) 106
A focus on talent 106
Identifying what works 107
Changing wider culture 108
Case study 4: Havas India (media and advertising) 108
The case for change 108
From vision to implementation 108
Successful initiatives 109
Where next? 110
Case study 5: Executive Genesis, the Philippines (service contracting) 110
Employers' organizations make the difference 110
Supporting clients to make the most of DEI 111
Advice for other enterprises 111
References 112
Figure 1. Labour force participation rates for women and men, and the gender gap, 1995-2026, world and by region 30
Figure 2. Changes in labour force participation rates for women and men from pre-COVID-19 (2019) to post-COVID-19 (2026), world and by region 32
Figure 3. Women as a share of employers, world and by region, 1995-2025 33
Figure 4. Gross enrolment ratios for tertiary education for women and men, world average, 1995-2023 34
Figure 5. Gross enrolment ratios for tertiary education, women and men, world and by World Bank regional grouping, 1995 and 2023 or latest 35
Figure 6. Proportion of women in managerial positions, world and by region, 2000-25 36
Figure 7. Share of enterprises with women as the top manager, world and by World Bank regional grouping, 2023 36
Figure 8. Women's labour income as a percentage of men's labour income, world and by region, 2025 39
Figure 9. Enterprises reporting improved business outcomes from gender equality and diversity initiatives, 2018 and 2025 (percentage of respondents) 44
Figure 10. Enterprises reporting improved business outcomes from gender equality and diversity initiatives, by region and enterprise size, 2025... 45
Figure 11. Enterprises reporting improved business outcomes associated with specific gender equality and diversity initiatives, 2025... 46
Figure 12. Main drivers of gender equality and diversity initiatives, 2025 (percentage of respondents) 47
Figure 13. Enterprises reporting increased profits associated with gender equality and diversity initiatives that promote women in management,... 47
Figure 14. Reported profit increases associated with gender equality and diversity initiatives, by region and enterprise size, 2025... 49
Figure 15. Distribution of enterprises by women's share of the workforce, 2013, 2018 and 2025 (percentage of respondents) 57
Figure 16. Proportion of female employees by region and enterprise size, 2025 (percentage of respondents) 57
Figure 17. Enterprises employing women at different management levels, 2018 and 2025 (percentage of respondents) 57
Figure 18. Enterprises employing women at different management levels, by region and enterprise size, 2025 (percentage of respondents) 58
Figure 19. Women's representation at different management levels in enterprises, 2013, 2018 and 2025 (percentage of respondents) 59
Figure 20. Women's representation at different management levels in enterprises, 2025 (percentage of respondents) 61
Figure 21. Women's representation at different management levels, by enterprise size, 2025 (percentage of respondents) 61
Figure 22. Enterprises with a woman CEO, 2013, 2018 and 2025 (percentage of respondents) 62
Figure 23. Enterprises with a woman CEO, by region and enterprise size, 2025 (percentage of respondents) 63
Figure 24. Women's representation on company boards, 2013, 2018 and 2025 (percentage of respondents) 64
Figure 25. Women's representation on company boards, by region and enterprise size, 2025 (percentage of respondents) 65
Figure 26. Gender of the chair of the board, 2013, 2018 and 2025 65
Figure 27. Enterprises with a woman board chair, by region and enterprise size, 2025 (percentage of respondents) 66
Figure 28. Enterprises employing women as senior managers, by function, 2018 and 2025 (percentage of respondents) 67
Figure 29. Enterprises with gender balance at the senior management level, by sector, 2018 and 2025 (percentage of respondents) 68
Figure 30. Enterprises rating specific gender equality and diversity initiatives as highly effective, by region and enterprise size, 2025... 75
Figure 31. Enterprises that employ women at different managerial levels according to whether or not they have a diversity, equality and inclusion... 77
Figure 32. Enterprises with an equal employment opportunity or diversity and inclusion policy, 2013, 2018 and 2025 (percentage of respondents) 77
Figure 33. Enterprises with an equal employment opportunity or diversity and inclusion policy, by region and enterprise size, 2025... 78
Figure 34. Enterprises implementing gender equality and diversity initiatives, by area, 2013, 2018 and 2025 (percentage of respondents) 79
Figure 35. Enterprises implementing gender equality and diversity initiatives, by area, region and enterprise size, 2025 (percentage of respondents) 81
Figure 36. Enterprises with environmental, social and governance (ESG) and/or responsible business conduct (RBC) approaches,... 83
Figure 37. Enterprises publicly disclosing ESG and/or responsible business conduct (RBC) performance, by region and enterprise size, 2025... 84
Figure 38. Enterprises incorporating gender considerations into their ESG and/or responsible business conduct approaches,... 85
Figure 39. Enterprises including gender equality metrics in their ESG reporting or disclosure, by region and enterprise size, 2025... 86
Figure 40. Gender-related indicators and targets used by enterprises in ESG reporting or disclosure, 2025 (percentage of respondents) 87
Figure A1.1. Regions of surveyed enterprises, 2025 93
Figure A1.2. Economic sectors of surveyed enterprises, 2025 93
Figure A2.1. Shares of female and male tertiary STEM graduates by region, latest years 96
Figure A2.2. Proportion of women in junior, middle and senior management positions by country, latest available year 98
Figure A2.3. Proportion of women in senior and middle management positions by country, latest available year 98
Figure A2.4. Proportion of women in senior and middle management and all management positions by region, country and territory, latest years 99
Figure A2.5. Hourly gender wage gap among total employees and managers, by region and country, latest years 101
*표시는 필수 입력사항입니다.
| 전화번호 |
|---|
| 기사명 | 저자명 | 페이지 | 원문 | 기사목차 |
|---|
| 번호 | 발행일자 | 권호명 | 제본정보 | 자료실 | 원문 | 신청 페이지 |
|---|
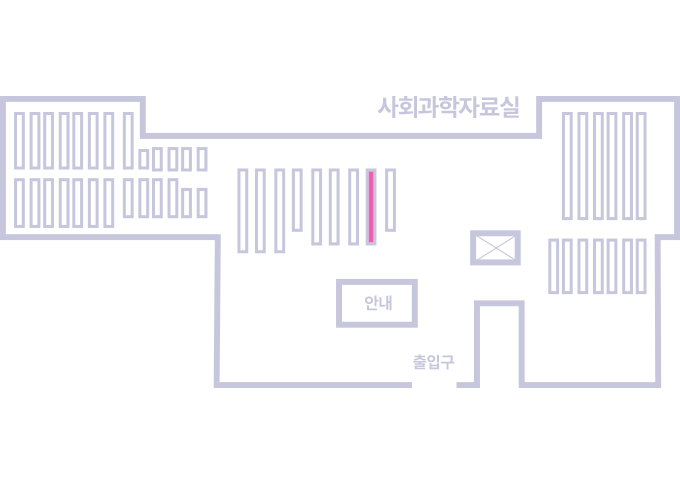
도서위치안내: / 서가번호:
우편복사 목록담기를 완료하였습니다.
*표시는 필수 입력사항입니다.
저장 되었습니다.