대표어
 https://www.oecd.org/en/publications/oecd-regions-and-cities-at-a-glance-2026_1fc64125-en.html
권호기사보기
| 기사명 | 저자명 | 페이지 | 원문 | 기사목차 |
|---|
결과 내 검색
동의어 포함
Title page 1
Contents 6
Foreword 4
Editorial 5
Reader's guide 8
Executive summary 13
1. Competitiveness 16
Economic performance 17
Industries and regional productivity 21
AI and innovation 23
2. Demography and labour 28
Demographic change 29
Geographic mobility 33
Local labour markets 37
3. Well-being 40
Housing 41
Life satisfaction, social connections and trust 43
Social infrastructure 45
4. Environment 50
Impacts of a changing climate 51
Trends in GHG emissions and electrification 55
Sectoral trends in electrification and energy efficiency 57
Annex A. Description of regions and functional geographies 59
Annex B. Sources and data description 61
Annex C. Methodologies 74
Figure 1.1. Labour productivity growth in regions 18
Figure 1.2. Top-to-bottom disparities in GDP per capita 18
Figure 1.3. Labour productivity and utilisation contributions to regional GDP per capita growth 18
Figure 1.4. Regional GDP per capita growth - Americas 19
Figure 1.5. Regional GDP per capita growth - Europe, East Asia and Oceania 20
Figure 1.6. Labour productivity growth components and sectoral contributions to productivity growth within sectors 22
Figure 1.7. Regional disparities in labour productivity: Change and sectoral contributions 22
Figure 1.8. Exposure to GenAI in regions 24
Figure 1.9. Firm AI adoption rates and GenAI exposure 24
Figure 1.10. Concentration of venture capital funding in regions 24
Figure 1.11. Patent concentration relative to population in FUAs - Americas 25
Figure 1.12. Patent concentration relative to population in FUAs - Europe and Asia-Oceania 26
Figure 2.1. Population change 30
Figure 2.2. Population projections in regions 30
Figure 2.3. Natural population change (births minus deaths) in regions 30
Figure 2.4. Old-age dependency ratio in regions - Americas 31
Figure 2.5. Old-age dependency ratio in regions - Europe and Oceania 32
Figure 2.6. Change in the share of population in metropolitan regions 34
Figure 2.7. Internal population inflow rate 34
Figure 2.8. Internal and international net flows by type of region 34
Figure 2.9. GDP per capita gaps in regions by type of region 34
Figure 2.10. Internal net flows across regions - Americas 35
Figure 2.11. Internal net flows across regions - Europe, Oceania and Asia-Pacific 36
Figure 2.12. Disparities in unemployment rates between labour market areas 38
Figure 2.13. Unemployment rates in labour markets areas 38
Figure 2.14. Changes in working-age population in labour market areas 38
Figure 2.15. Share of foreign-born population in labour market areas 38
Figure 3.1. Housing prices within and outside functional urban areas 42
Figure 3.2. Housing price-to-income ratios in metropolitan regions 42
Figure 3.3. Unoccupied housing within and outside functional urban areas 42
Figure 3.4. Changes in housing supply and population in functional urban areas 42
Figure 3.5. Change in life satisfaction in regions 44
Figure 3.6. Social connections in cities vs. rural areas 44
Figure 3.7. Institutional trust in metropolitan and non-metropolitan regions 44
Figure 3.8. Social infrastructure facilities and settlement size 46
Figure 3.9. Cultural facilities in towns by proximity to the nearest city 46
Figure 3.10. Public community facilities in villages by proximity to a larger settlement 46
Figure 3.11. Access to eating and drinking facilities in regions 46
Figure 3.12. Cultural facilities in urban centres in North America 47
Figure 3.13. Cultural facilities in urban centres in Europe and New Zealand 48
Figure 4.1. Air temperature increase in regions 52
Figure 4.2. Old-age vulnerability to heat stress in regions 52
Figure 4.3. Total precipitation change - Americas 53
Figure 4.4. Total precipitation change - Europe and Asia-Pacific 54
Figure 4.5. GHG emissions trends by settlement type 56
Figure 4.6. Diversifying the electricity generation mix in regions 56
Figure 4.7. Electrification of end use in regions 56
Figure 4.8. Energy efficiency gaps in the residential sector by degree of urbanisation 58
Figure 4.9. Electrification of industry in regions 58
Figure 4.10. Electrification of transport in regions 58
Figure C.1. Components of CV of regional GVA per worker decomposition 75
Figure C.2. Industry contributions to regional labour productivity disparities by country 75
Figure C.3. Merging French LMAs that each overlap with the same FUA for more than 50% of their population 77
Figure C.4. Degree of urbanisation of small administrative units and LMA boundaries 78
Figure C.5. Classification of LMAs by degree of urbanisation 79
*표시는 필수 입력사항입니다.
| 전화번호 |
|---|
| 기사명 | 저자명 | 페이지 | 원문 | 기사목차 |
|---|
| 번호 | 발행일자 | 권호명 | 제본정보 | 자료실 | 원문 | 신청 페이지 |
|---|
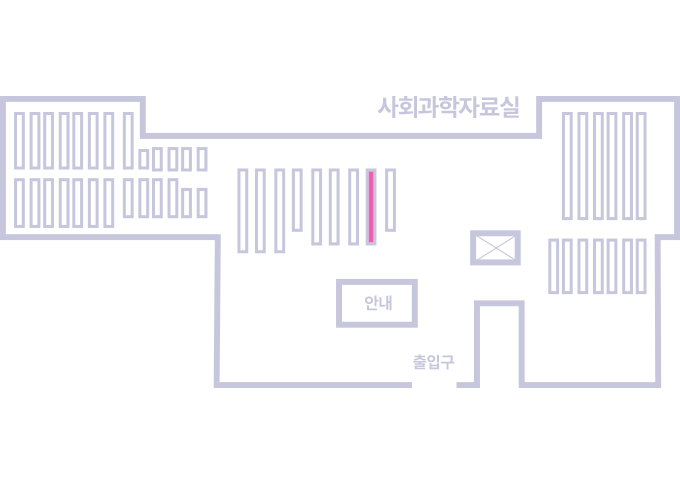
도서위치안내: / 서가번호:
우편복사 목록담기를 완료하였습니다.
*표시는 필수 입력사항입니다.
저장 되었습니다.