대표어
 https://www.oecd.org/en/publications/the-ocean-economy-at-a-glance_da6da926-en.html
권호기사보기
| 기사명 | 저자명 | 페이지 | 원문 | 기사목차 |
|---|
결과 내 검색
동의어 포함
Title page 1
Contents 6
Foreword 4
Acknowledgements 5
Reader's guide 9
Executive summary 14
1. The scale, structure and performance of the global ocean economy 16
2. Trends in ocean research and policies for ocean science, technology and innovation 29
3. Food from the ocean: Marine fishing, aquaculture and fish processing 41
4. Energy, minerals and fresh water from the ocean: Offshore energy and marine non-living resources 51
5. Moving goods and people across the ocean: Maritime transport, ports, shipbuilding and equipment manufacturing 62
6. The ocean for recreation and leisure: Marine and coastal tourism 73
Figure 1.1. The ocean economy's share of world gross value added peaked in 2012 and was higher outside the OECD area in every year 18
Figure 1.2. The ocean economy outgrew the overall economy between 1995 and 2025 19
Figure 1.3. Non-OECD Asia became the largest regional producer of ocean economy gross value added in 2010 and the OECD area's share... 20
Figure 1.4. Marine and coastal tourism and offshore energy and marine non-living resources took turns as the largest component of the... 21
Figure 1.5. Maritime industries grew fastest of the five components and led ocean economy growth in more years than any other area,... 22
Figure 1.6. The top ten ocean economies in 2025 are geographically broader than they were in 1995 23
Figure 1.7. Marine and coastal tourism replaced marine fishing, aquaculture and processing as the largest employer in the ocean economy in 2005 24
Figure 1.8. Labour productivity in the ocean economy rose faster than in the overall economy 25
Figure 1.9. Dependence on the ocean economy for national gross value added converged across economies between 1995 and 2025 26
Figure 2.1. Ocean scientific publications grew a little faster than science as a whole between 1996 and 2024 31
Figure 2.2. Non-OECD Asia became the largest region producing ocean-related scientific publications in 2017 32
Figure 2.3. China has produced the largest number of ocean scientific publications of any economy every year since 2018 33
Figure 2.4. Offshore wind, wave and tidal energy and desalination and water-treatment technologies grew fastest of all themes of ocean science... 34
Figure 2.5. Different regions specialise in different themes of ocean science with engineering dominating non-OECD Asia and marine life... 35
Figure 2.6. Ocean STI policies address net zero transitions far more often than STI policies in general 37
Figure 2.7. Dedicated ocean STI policies favour collaborative infrastructures while broader ones favour governance instruments 38
Figure 2.8. Specialisation in ocean science is loosely associated with a country's dependence on the ocean economy 39
Figure 3.1. Marine fishing, aquaculture and processing grew more slowly than the ocean economy and its share of ocean economy gross value... 43
Figure 3.2. The bulk of marine fishing, aquaculture and processing activity moved from OECD Asia to non-OECD Asia over the period 44
Figure 3.3. Marine aquaculture grew fastest and contributed most to the real growth of marine fishing, aquaculture and processing after 2008 45
Figure 3.4. Marine capture fishing generated the largest share of gross value added in every year between 1995 and 2025, although its share... 46
Figure 3.5. China became the largest generator of marine fishing, aquaculture and processing gross value added in 2006 47
Figure 3.6. Employment in marine fishing, aquaculture and processing fell by a third between 1995 and 2025, mostly in Chinese capture fisheries 48
Figure 3.7. Labour productivity in marine fishing, aquaculture and processing more than tripled in real terms, four times the rise in the... 49
Figure 3.8. Dependence on marine fishing, aquaculture and processing narrowed across economies between 1995 and 2025 50
Figure 4.1. Offshore energy and marine non-living resources grew in real gross value added terms between 1995 and 2025 but did so at a... 53
Figure 4.2. Offshore energy and marine non-living resources grew and contracted in different years than the ocean economy as a whole 54
Figure 4.3. Offshore wind and marine renewables grew fastest while offshore oil and gas extraction contributed most to the real growth of... 55
Figure 4.4. Offshore oil and gas extraction generated more than nine-tenths of the gross value added of offshore energy and marine non-living... 56
Figure 4.5. Non-OECD Asia is the largest regional generator of gross value added in offshore energy and marine non-living resources and... 57
Figure 4.6. Many economies where offshore energy and marine non-living resources represented a large share of their overall economies... 58
Figure 4.7. Employment in offshore energy and marine non-living resources increased by almost 50 per cent between 1995 and 2025 59
Figure 4.8. Labour productivity in offshore energy and marine non-living resources rose in real terms between 1995 and 2025 but by less than... 60
Figure 4.9. Offshore extraction and mining held their shares in their parent industries between 1995 and 2025, while offshore wind and... 61
Figure 5.1. Maritime industries grew faster in real terms than the ocean economy and the overall economy to more than triple its level in 1995... 64
Figure 5.2. Maritime industries grew fastest in real terms of the five components of the ocean economy between 1995 and 2025 65
Figure 5.3. Maritime industries fell further than the ocean economy in 2009 after the global financial crisis but contracted less in 2020 during... 66
Figure 5.4. Sea and coastal transport and maritime ports grew fastest in real terms of the activities of maritime industries between 1995 and... 67
Figure 5.5. Maritime ports and sea and coastal transport generated the largest shares of maritime industries' gross value added throughout... 68
Figure 5.6. Non-OECD Asia emerged as the largest maritime industries region during the 2008 to 2019 period 69
Figure 5.7. China has generated the largest share of world gross value added from any maritime industries economy since 2012 70
Figure 5.8. Maritime ports added almost all of the jobs that maritime industries gained between 1995 and 2025 71
Figure 5.9. Labour productivity in maritime industries more than doubled in real terms while the OECD area's lead over non-OECD... 72
Figure 6.1. Marine and coastal tourism was the largest area of the ocean economy in most years, but its share of the ocean economy fell from... 75
Figure 6.2. The real gross value added of marine and coastal tourism fell almost three times as far as the ocean economy's during the... 76
Figure 6.3. Accommodation for visitors contributed most to the real growth of marine and coastal tourism in each of the three periods while... 77
Figure 6.4. Accommodation for visitors produced the largest share of the gross value added of marine and coastal tourism in every year... 78
Figure 6.5. The leading regional economy in marine and coastal tourism changed hands three times over the period with the OECD area... 79
Figure 6.6. The United States has been the largest producer of marine and coastal tourism gross value added since 2004 and recovered... 80
Figure 6.7. Full-time equivalent employment in marine and coastal tourism nearly doubled between 1995 and 2025, mostly in food and... 81
Figure 6.8. Labour productivity in marine and coastal tourism rose in both the OECD area and economies outside it but barely increased... 82
Figure 6.9. Dependence on marine and coastal tourism for jobs increased the most in economies where it was already highest 83
Boxes 8
Box 2.1. How were the statistics on ocean-related scientific publications estimated? 36
*표시는 필수 입력사항입니다.
| 전화번호 |
|---|
| 기사명 | 저자명 | 페이지 | 원문 | 기사목차 |
|---|
| 번호 | 발행일자 | 권호명 | 제본정보 | 자료실 | 원문 | 신청 페이지 |
|---|
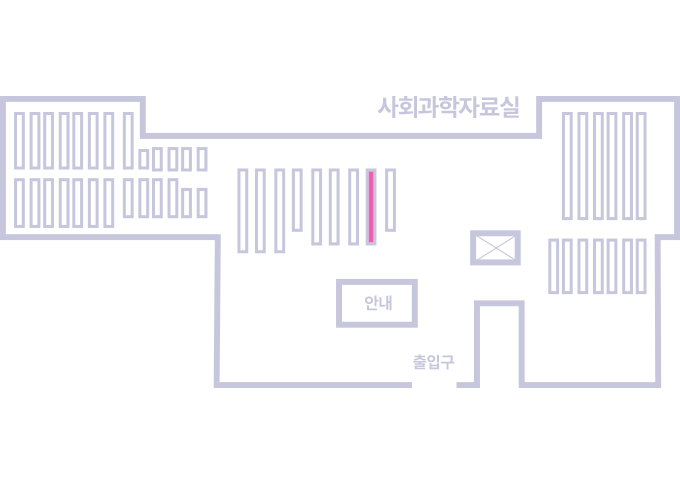
도서위치안내: / 서가번호:
우편복사 목록담기를 완료하였습니다.
*표시는 필수 입력사항입니다.
저장 되었습니다.