
 대표어
대표어
 http://bookshop.europa.eu/en/strest-report-on-lessons-learned-from-recent-catastrophic-events-pbLBNA27206/;pgid=Iq1Ekni0.1lSR0OOK4MycO9B0000yXs11PRy;sid=foEr-OuCYsUr4rxT57S1X4mneVItK-xReFI=?CatalogCategoryID=aLoKABstP1sAAAEjGIkY4e5K
권호기사보기
| 기사명 | 저자명 | 페이지 | 원문 | 기사목차 |
|---|
결과 내 검색
동의어 포함
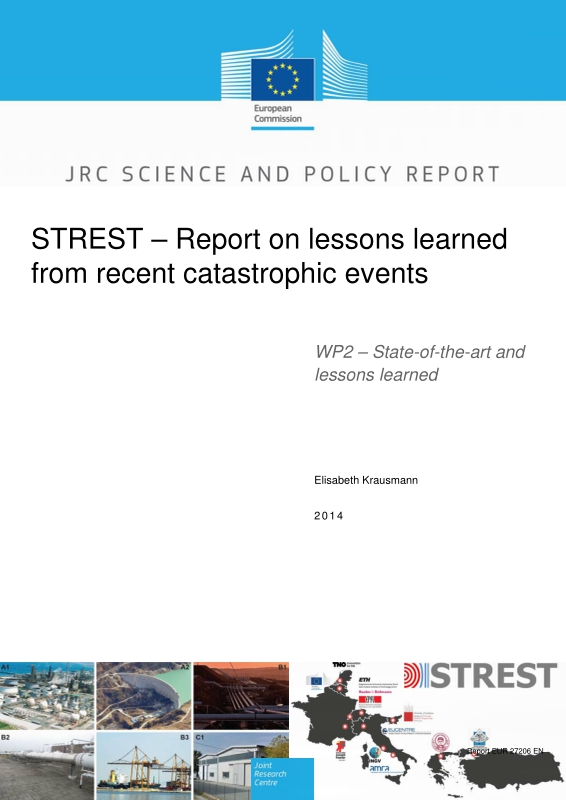
Title page
Contents
Abstract 4
Acknowledgments 5
Deliverable Contributors 6
1. Introduction 16
2. Refineries and petrochemical facilities 18
2.1. EARTHQUAKES 18
2.1.1. Great East Japan (Tohoku) earthquake, Japan, 11 March 2011 18
2.1.2. Kocaeli earthquake, Turkey, 17 August 1999 21
2.1.3. Northridge Earthquake, USA, 17 January, 1994 26
2.2. LESSONS LEARNED FROM EARTHQUAKES 29
2.2.1. Systems weaknesses and critical components 29
2.2.2. Potential for propagation 30
2.2.3. Consequence severity and extent 30
2.2.4. Protection measures and systems 30
References 31
2.3. TSUNAMIS 33
2.3.1. Great East Japan earthquake tsunami, Japan, 11 March 2011 33
2.4. LESSONS LEARNED FROM TSUNAMIS 37
2.4.1. Systems weaknesses and critical components 37
2.4.2. Potential for propagation 38
2.4.3. Consequence severity and extent 38
2.4.4. Protection measures and systems 38
References 40
3. Large dams 41
3.1. EARTHQUAKES 41
3.1.1. Wenchuan earthquake, China, 12 May 2008 41
3.2. LESSONS LEARNED FROM EARTHQUAKES 44
3.2.1. Systems weaknesses and critical components 44
3.2.2. Potential for propagation 44
3.2.3. Consequence severity and extent 45
3.2.4. Protection measures and systems 45
References 46
3.3. FLOODS 48
3.3.1. Central Europe floods, Poland, 7 August 2010 48
3.4. LESSONS LEARNED FROM FLOODS 50
3.4.1. Systems weaknesses and critical components 50
3.4.2. Potential for propagation 50
3.4.3. Consequence severity and extent 51
3.4.4. Protection measures and systems 51
References 53
4. Hydrocarbon pipelines 54
4.1. EARTHQUAKES 54
4.1.1. Northridge Earthquake, USA, 17 January 1994 54
4.1.2. Kocaeli Earthquake, Turkey, 17 August 1999 55
4.2. LESSONS LEARNED FROM EARTHQUAKES 58
4.2.1. Systems weaknesses and critical components 58
4.2.2. Potential for propagation 59
4.2.3. Consequence severity and extent 59
4.2.4. Protection measures and systems 59
References 61
5. Gas storage and distribution 63
5.1. EARTHQUAKES 63
5.1.1. L'Aquila Earthquake, Italy, 6 April 2009 63
5.1.2. Northridge Earthquake, USA, 17 January 1994 68
5.2. LESSONS LEARNED FROM EARTHQUAKES 73
5.2.1. Systems weaknesses and critical components 73
5.2.2. Potential for propagation 74
5.2.3. Consequence severity and extent 74
5.2.4. Protection measures and systems 74
References 75
5.3. INDUCED SEISMICITY 76
6. Ports 77
6.1. EARTHQUAKES 77
6.1.1. Hyogo-Ken Nanbu (Kobe) earthquake, Japan, 17 January 1995 77
6.1.2. Great East Japan (Tohoku) earthquake, Japan, 11 March 2011 86
6.1.3. Kocaeli earthquake, Turkey, 17 August 1999 96
6.2. LESSONS LEARNED FROM EARTHQUAKES 99
6.2.1. Systems weaknesses and critical components 99
6.2.2. Potential for propagation 100
6.2.3. Consequence severity and extent 101
6.2.4. Protection measures and systems 101
References 102
6.3. TSUNAMIS 105
6.3.1. Great East Japan earthquake tsunami, Japan, 11 March 2011 105
6.4. LESSONS LEARNED FROM TSUNAMIS 110
6.4.1. Systems weaknesses and critical components 110
6.4.2. Potential for propagation 110
6.4.3. Consequence severity and extent 111
6.4.4. Protection measures and systems 111
References 112
7. Industrial districts 114
7.1. EARTHQUAKES 114
7.1.1. Northridge Earthquake, USA, 17 January, 1994 114
7.1.2. Kocaeli earthquake, Turkey, 17 August 1999 117
7.1.3. L'Aquila Earthquake, Italy, 6 April 2009 121
7.1.4. Christchurch Earthquake, Australia, 22 February 2011 124
7.1.5. Emilia Romagna Earthquakes, Italy, 20 and 29 May 2012 128
7.2. LESSONS LEARNED FROM EARTHQUAKES 132
7.2.1. Systems weaknesses and critical components 132
7.2.2. Potential for propagation 133
7.2.3. Consequence severity and extent 134
7.2.4. Protection measures and systems 134
References 136
7.3. FLOODS 139
7.3.1. Thai Floods, Thailand, 2011 139
7.4. LESSONS LEARNED FROM FLOODS 142
7.4.1. Systems weaknesses and critical components 142
7.4.2. Potential for propagation 142
7.4.3. Consequence severity and extent 143
7.4.4. Protection measures and systems 143
References 144
8. Conclusions 145
Fig. 2.1. The LPG tank farm at the Chiba refinery after the earthquake-triggered fires and explosions (©2012 Google, ZENRIN) 20
Fig. 2.2. Location of the refinery of Tupras 22
Fig. 2.3. Aerial view of the Tupras refinery after the Kocaeli earthquake 23
Fig. 2.4. Tank fire at Tupras refinery due to collision of the floating roof with the tank wall (Courtesy of Tupras A.S. (TUPRAS, 2000)) 24
Fig. 2.5. Burned cooling tower (left) by the radiant heat of the burning tanks and damaged heater due to collapse of the stack (left) at TUPRAS refinery 24
Fig. 2.6. Damage and fire at the pipe rack due to collapsed stack at TUPRAS refinery 25
Fig. 2.7. Locations of damaged and burned tanks (JSCE, 1999) 25
Fig. 2.8. Elephant foot buckling of a bolted steel tank 28
Fig. 2.9. Pulling out and twisting of the anchor bolts (Lau et al. 1995) 29
Fig. 2.10. Part of the Sendai refinery's western section that was consumed by flames(©2011 Google, ZENRIN) 36
Fig. 2.11. Burned hydrocarbon tank at the JX Sendai refinery (TCLEE, 2012) 36
Fig. 2.12. Heavy oil release due to tsunami-triggered damage at the Sendai refinery(©2011 Google, ZENRIN) 37
Fig. 3.1. Fracture at the Zipingpu dam's crown (taken from Lekkas, 2008) 43
Fig. 3.2. Failure of the Niedow dam in Poland due to flooding (taken from Fry et al., 2012) 49
Fig. 4.1. The ground-supported unseated crude oil unloading pipeline fell from the supports at TUPRAS refinery due to inertial effects (Courtesy of TUPRAS (2000)) 57
Fig. 4.2. Failure (wrinkling) of a large diameter welded steel pipe crossing the ruptured fault in Arifiye (East of Izmit (left) (Takada et al., 2001) and buckled steel pipe connection (Bilham et al. 2003) 57
Fig. 4.3. Trans-Alaska pipeline crossing the Denali fault line (USGS, 2003) 60
Fig. 5.1. Damage to gas pipes following the L'Aquila earthquake: gas welded joint of a LP steel pipe pulled apart in Paganica (Esposito et al., 2013) 65
Fig. 5.2. Repair operations addressing damage to buried components for the entire gas network: number of repairs distinguished with respect to pressure level and pipe material (Esposito et al., 2013) 65
Fig. 5.3. Damage to stations: repairs to the input/output network of Onna M/R and inclusion of stop-system (left); RG housed in a masonry kiosk closed to building and damaged following the earthquake (right) (Photos courtesy of ENEL Rete Gas) 65
Fig. 5.4. Repair operations addressing damage to buried components for the portion of the gas network located in Zone 1: number of repairs for different buried components(Esposito et al., 2013) 66
Fig. 5.5. Observed resilience-related curve for the L'Aquila gas network following the 2009 event (Esposito et al., 2013) 68
Fig. 5.6. Damaged support of aboveground gas line (Lau et al., 1995) 70
Fig. 5.7. Buried gas line exposed by landslide (Lau et al., 1995) 70
Fig. 5.8. Shear failure of gas line (Lau et al., 1995) 70
Fig. 5.9. Compression failure of gas and water lines (Lau et al., 1995) 71
Fig. 5.10. Tension failure of gas line (Lau et al., 1995) 71
Fig. 5.11. Cycled compression, tension and buckling failure of gas line (Lau et al., 1995) 71
Fig. 5.12. Burning of leaked gas from ruptured gas line 73
Fig. 6.1. Field observation of RHD for damaged quay walls at the Rokko Island in Kobe port (Inatomi et al., 1997) 79
Fig. 6.2. Extremely extensive damage to apron pavements 79
Fig. 6.3. Lateral spreading, liquefaction and settlement along the shore of the Port of Kobe 79
Fig. 6.4. Seaward displacement and tilting of quay-walls 80
Fig. 6.5. Typical damage modes for gravity type quay walls and parameters for damage criteria (Na et al., 2008) 80
Fig. 6.6. Damage to a quay-wall at the port of Kobe (Nozu et al., 2004) 81
Fig. 6.7. Seaward lateral movement of rail foundation and differential settlement of rails (Rokko Island) 82
Fig. 6.8. Crane total collapse. Various damages to other cranes like plastic hinges and bending of their members (Rokko Island) 82
Fig. 6.9. Crane damage due to deformation of foundation soil 82
Fig. 6.10. Sand emersion near container cranes (Port Island) 82
Fig. 6.11. Map of Kobe showing the seismologically inferred earthquake fault and acceleration stations showing the recorded PGA. The shaded region shows the area of highest structural damage (Dakoulas and Gazetas, 2008) 83
Fig. 6.12. Restoration of the port of Kobe after the Hyogo-Ken Nanbu 1995. earthquake (Chang, 2000a) 85
Fig. 6.13. Ship cargo traffic in Asia during the years 1992-1997 (Chang, 2000b) 85
Fig. 6.14. Sendai Port (Percher, 2014) 87
Fig. 6.15. Lateral spreading in the backlands along the original shoreline (Percher, 2014) 89
Fig. 6.16. Rotated wharf closure bulkhead at the east end of the Takasago wharf (Percher, 2014) 89
Fig. 6.17. Significant vertical settlement near the east end the Takasago wharf (Percher, 2014) 90
Fig. 6.18. Ground failure behind the quay wall at Sendai port (TCLEE, 2012) 90
Fig. 6.19. Differential vertical movements of the crane rail girders and settlement of fill surface (Percher, 2014) 91
Fig. 6.20. Landside crane rails at the eastern side of Takasago Wharf (Percher, 2014) 93
Fig. 6.21. Crane damage at Sendai Port (TCLEE, 2012) 93
Fig. 6.22. Movement of waterside base isolated crane rails (Percher, 2014) 94
Fig. 6.23. Comparison of velocity response spectra due to different soil conditions (Motosaka, 2012) 94
Fig. 6.24. Location of port structures around Izmit Bay 97
Fig. 6.25. Collapse of ground slabs due to settlement at the Navy port in Gölcük (left) and damage at Derince port (right) 98
Fig. 6.26. Damage at the navy port in Golcuk (left) and failed column at SEKA port (right) 98
Fig. 6.27. A displaced steel piped jetty in Izmit (left) and a damaged jetty at Goolcuk Naval Base (Bilham et al., 2003) 98
Fig. 6.28. Inundation heights in Sendai Port (Percher, 2014) 105
Fig. 6.29. Container ship swept ashore by tsunami at Sendai Port and damage on crane (TCLEE, 2012) 107
Fig. 6.30. Scattered containers Sendai Port after the tsunami (Tomita and Yoem, 2012) 107
Fig. 6.31. Sendai tsunami inundation hazard map (Koshimura, 2012) 108
Fig. 7.1. Collapse of roof and wall elements of an old tilt-up building (Photo by G. Sakkestad) 115
Fig. 7.2. Damage to industrial storage racks and equipment during Northridge Earthquake (Photos taken from FEMA 460 (2005) and FEMA E-74 (2011)) 115
Fig. 7.3. Precast Industrial buildings sustained various degrees of structural damage (taken from Saatciocglu et al., 2001) 118
Fig. 7.4. Precast structures in the same industrial zone under different construction stages and corresponding damage levels (taken from Saatcioglu et al. (2001)) 118
Fig. 7.5. Observed damage to precast industrial buildings (taken from Saatcioglu et al., 2001) 119
Fig. 7.6. Double cantilever to column connection failures (taken from Saatcioglu et al., 2001) 119
Fig. 7.7. Damage to structural elements observed by Toniolo and Colombo (2012) 122
Fig. 7.8. Damage to connections and fastenings (Toniolo and Colombo, 2012) 122
Fig. 7.9. Collapse of precast wall panels (Di Sarno et al., 2011) 123
Fig. 7.10. Minor cracking in concrete panels (taken from Henry and Ingham (2011)) 125
Fig. 7.11. Out-of-plane buckling of concrete wall panels (taken from Henry and Ingham (2011)) 126
Fig. 7.12. Panel collapse due to steel frame connection failure (taken from Marshall and Gould (2012)) 126
Fig. 7.13. Observed damage to industrial buildings (taken from Liberatore et al. (2013)) 129
Fig. 7.14. Observed damage to beam-column connections (Source: Roberto Nascimbene, Eucentre) 130
Fig. 7.15. Inclined beam (a) and knee portal (b) sawtooth roofs (Liberatore et al., 2013) 133
Fig. 7.16. Inundation level at industrial estates near northern Bangkok 140
Fig. 7.17. Inundated automotive factory and submerged cars in Ayutthaya Province 142
*표시는 필수 입력사항입니다.
| 전화번호 |
|---|
| 기사명 | 저자명 | 페이지 | 원문 | 기사목차 |
|---|
| 번호 | 발행일자 | 권호명 | 제본정보 | 자료실 | 원문 | 신청 페이지 |
|---|
도서위치안내: / 서가번호:

우편복사 목록담기를 완료하였습니다.
*표시는 필수 입력사항입니다.
저장 되었습니다.
