
 대표어
대표어
 http://bookshop.europa.eu/en/the-ict-landscape-in-brazil-india-and-china-pbLFNA26923/;pgid=Iq1Ekni0.1lSR0OOK4MycO9B0000WzcWnsIn;sid=ddIvPiGySyMvN3ZgftqxmUOXcgEp7WzRa6A=?CatalogCategoryID=aLoKABstP1sAAAEjGIkY4e5K
권호기사보기
| 기사명 | 저자명 | 페이지 | 원문 | 기사목차 |
|---|
결과 내 검색
동의어 포함
Title page
Contents
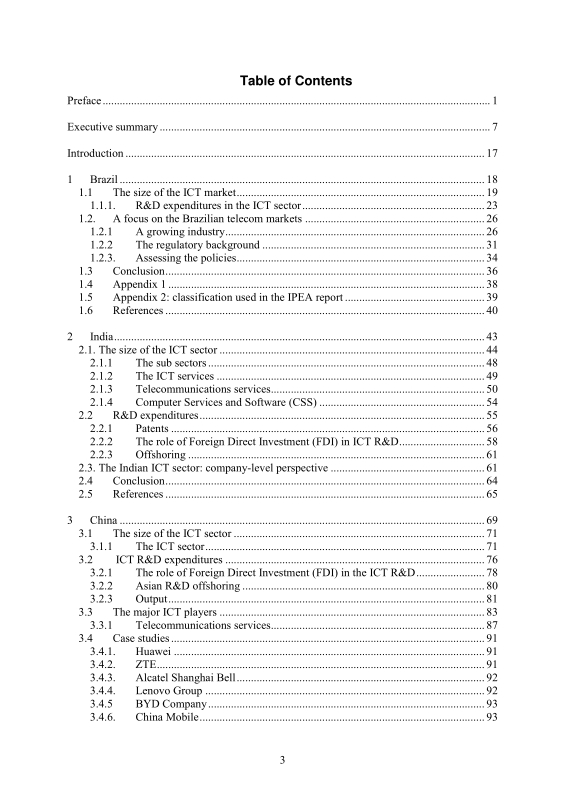
Preface 3
Executive summary 8
Introduction 17
1. Brazil 18
1.1. The size of the ICT market 19
1.1.1. R&D expenditures in the ICT sector 23
1.2. A focus on the Brazilian telecom markets 26
1.2.1. A growing industry 26
1.2.2. The regulatory background 31
1.2.3. Assessing the policies 34
1.3. Conclusion 36
1.4. Appendix 1: Proportion of housholds that have ict equipment 38
1.5. Appendix 2: classification used in the IPEA report 39
1.6. References 40
2. India 42
2.1. The size of the ICT sector 43
2.1.1. The sub sectors 47
2.1.2. The ICT services 48
2.1.3. Telecommunications services 49
2.1.4. Computer Services and Software (CSS) 53
2.2. R&D expenditures 54
2.2.1. Patents 55
2.2.2. The role of Foreign Direct Investment (FDI) in ICT R&D 57
2.2.3. Offshoring 60
2.3. The Indian ICT sector: company-level perspective 60
2.4. Conclusion 63
2.5. References 64
3. China 67
3.1. The size of the ICT sector 69
3.1.1. The ICT sector 69
3.2. ICT R&D Expenditures 74
3.2.1. The role of Foreign Direct Investment (FDI) in the ICT R&D trends 76
3.2.2. Asian R&D offshoring 78
3.2.3. Output 79
3.3. The major ICT players 81
3.3.1. Telecommunications services 85
3.4. Case studies 89
3.4.1. Huawei 89
3.4.2. ZTE 89
3.4.3. Alcatel Shanghai Bell 90
3.4.4. Lenovo Group 90
3.4.5. BYD Company 91
3.4.6. China Mobile 91
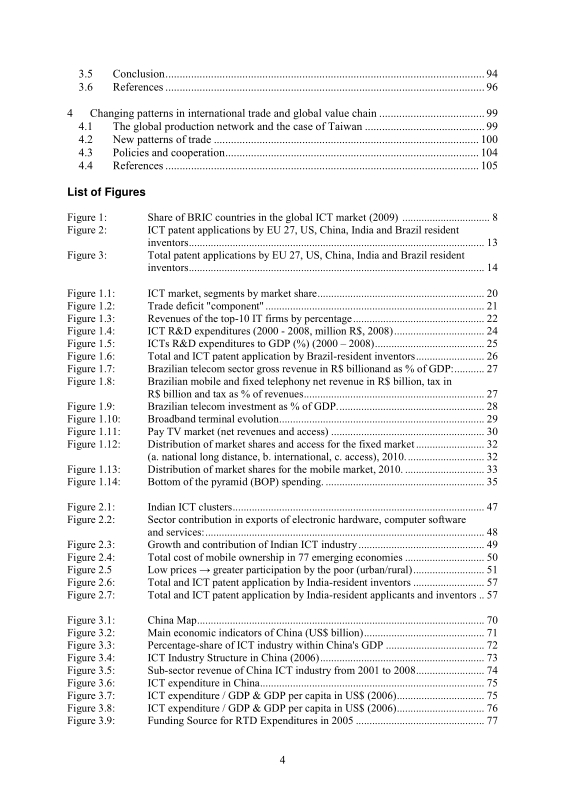
3.5. Conclusion 92
3.6. References 94
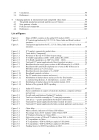
4. Changing patterns in international trade and global value chain 97
4.1. The global production network and the case of Taiwan 97
4.2. New patterns of trade 98
4.3. Policies and cooperation 102
4.4. References 103
Abstract 104
Figure 1. Share of BRIC countries in the global ICT market (2009) 9
Figure 2. ICT patent applications by EU 27, US, China, India and Brazil resident inventors 14
Figure 3. Total patent applications by EU 27, US, China, India and Brazil resident inventors 15
Figure 1.1. ICT market, segments by market share 20
Figure 1.2. Trade deficit "component" 21
Figure 1.3. Revenues of the top-10 IT firms by percentage 22
Figure 1.4. ICT R&D expenditures (2000-08, million RS 2008) 24
Figure 1.5. ICTs R&D expenditures to GDP (2000-2008) 25
Figure 1.6. Total and ICT patent application by Brazil-resident inventors 26
Figure 1.7. Brazilian telecom sector gross revenue in R$ billion64and as % of GDP 27
Figure 1.8. Brazilian mobile and fixed telephony net revenue in R$ billion, tax in R$ billion and tax as % of revenues 27
Figure 1.9. Brazilian telecom investment as % of GDP 28
Figure 1.10. Broadband terminal evolution 29
Figure 1.11. Pay TV market (net revenues and access) 30
Figure 1.12. Distribution of market shares and access for the fixed market 32
Figure 1.13. Distribution of market shares for the mobile market (2010) 33
Figure 1.14. Bottom of the pyramid (BOP) spending 35
Figure 2.1. Indian ICT clusters 46
Figure 2.2. Sector contribution in exports of electronic hardware, computer software and services (2005-06) 47
Figure 2.3. Growth and contribution of Indian ICT industry 48
Figure 2.4. Total cost of mobile ownership in 77 emerging economies 49
Figure 2.5. Low prices greater participation by the poor 50
Figure 2.6. Total and ICT patent application by India-resident inventors 56
Figure 2.7. Total and ICT patent application by India-resident applicants and inventors 56
Figure 3.1. China Map 68
Figure 3.2. Main economic indicators of China 69
Figure 3.3. Percentage-share of ICT industry within China's GDP 70
Figure 3.4. ICT Industry Structure in China (2006) 71
Figure 3.5. Sub-sector revenue of China ICT industry (2001-08) 72
Figure 3.6. ICT expenditure in China 73
Figure 3.7. ICT expenditure / GDP & GDP per capita in US$ (2006) 73
Figure 3.8. ICT expenditure / GDP & GDP per capita in US$ (2006) 74
Figure 3.9. Funding Source for RTD Expenditures in 2005 75
Figure 3.10. RTD expenditure percentages by industrial sector in China (2006) 76
Figure 3.11. Total and ICT patent application by China-resident inventors 80
Figure 3.12. Inventive patents owned by the industrial sector in China (2006) 80
Figure 4.1. The Global Innovation Network of Apple's iPhones and the Role of the Taiwanese ICT Firms 97
Boxes
Box 1. Methodology for patent data 14
Box 2.1. Performance of IT services firms in India 45
Box 2.2. The budget telecom model: market innovations that meet consumer's ability to pay 51
Box 2.3. The three leading Indian IT firms 63
Box 3.1. NACE Code and Corresponding industries in China's ICT sector 71
Box 3.2. China's R&D offshoring-the Huawei Case 79
Box 3.3. China's R&D offshoring-the ZTE case 79
Box 3.4. American firms in China's Top 20 ICT firms 84
Box 3.5. European firms in China's Top 20 ICT firms 84
Box 3.6. The telecommunications and internet markets. historical background 87
Box 3.7. Internet companies. moving to the top 88
Graphs
Graph 1.1. Trade deficit ICT 21
Graph 3.1. China's non-financial OFDI flows for (1990-2008) 78
Annex Tables
Annex Table 1. Mobile phone market share for different brands 85
*표시는 필수 입력사항입니다.
| 전화번호 |
|---|
| 기사명 | 저자명 | 페이지 | 원문 | 기사목차 |
|---|
| 번호 | 발행일자 | 권호명 | 제본정보 | 자료실 | 원문 | 신청 페이지 |
|---|
도서위치안내: / 서가번호:

우편복사 목록담기를 완료하였습니다.
*표시는 필수 입력사항입니다.
저장 되었습니다.
