
 대표어
대표어
 https://www.nrc.gov/reading-rm/doc-collections/nuregs/contract/cr7223/





권호기사보기
| 기사명 | 저자명 | 페이지 | 원문 | 기사목차 |
|---|
결과 내 검색
동의어 포함
Title page
Contents
ABSTRACT 4
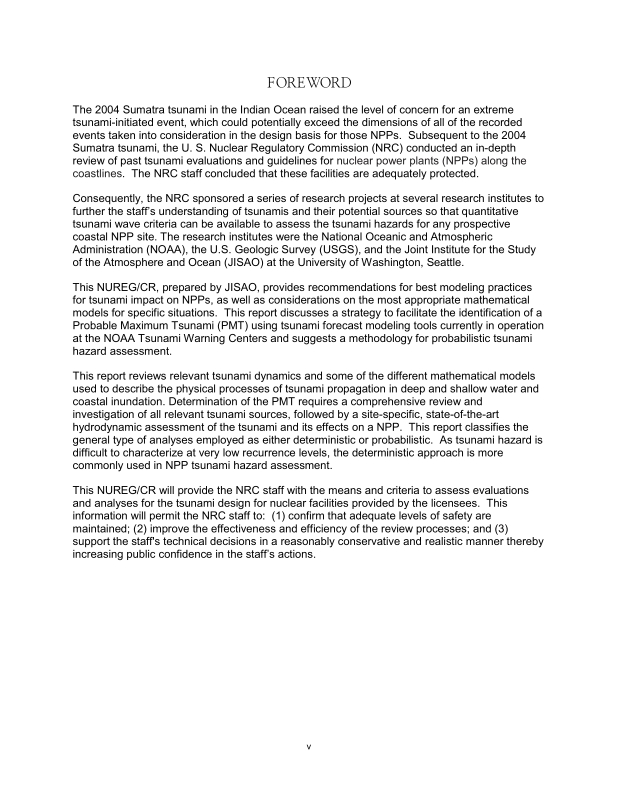
FOREWORD 5
EXECUTIVE SUMMARY 11
ACKNOWLEDGMENTS 12
ABBREVIATIONS 13
1. INTRODUCTION 14
2. BRIEF REVIEW OF TSUNAMI MECHANICS 15
3. TSUNAMI MODELS: THEORY 21
3.1. Linear Wave Theory 21
3.2. Nonlinear Shallow Water (Long Wave) Modeling 24
3.3. High-Order Approaches: Boussinesq-type Model 26
3.4. High-Order Approaches: Navier-Stokes Modeling 28
4. TSUNAMI MODELS: NUMERICAL SOLUTION METHODS 29
4.1. Numerical Solution Methods 29
4.2. Coupled and Hybrid Techniques 29
4.3. Moving Shoreline Algorithms 30
5. APPLICATION OF NUMERICAL MODELS 33
5.1. Specification of Initial Condition 33
5.2. Dynamic Bottom Boundary Conditions 33
5.3. Topographic Grid Creation 34
5.4. Grid and Time Steps 36
5.5. Bottom Friction and Turbulence Closure 36
5.6. Antecedent Water Level 36
5.7. Associated Effects 37
6. INTERPRETATION AND ANALYSIS OF NUMERICAL RESULTS 38
6.1. Numerical Convergence 38
6.2. Types of Output 38
6.2.1. Instantaneous Snapshots of Ocean Elevation and Speed 38
6.2.2. Time Series 39
6.2.3. Maximum and Minimum Surface Plots 39
6.2.4. Tabular Summary of Results 40
7. EVALUATING TSUNAMI HAZARDS NEAR CRITICAL FACILITIES 41
7.1. Deterministic Approach 41
7.2. Probabilistic Approaches 45
8. PRESENTATION OF TSUNAMI HAZARD ANALYSIS 49
9. A PRACTICAL APPROACH TO DETERMINING PMT 52
9.1. Background 52
9.2. NCTR's Forecasting Methodology 53
9.3. NCTR's Propagation Database 54
9.4. Real-time Simulation Computations 56
9.4.1. High-resolution Digital Elevation Models 57
9.4.2. Coverage of the Forecast Models 57
9.4.3. Development of NCTR's Forecast Models 58
9.5. Application to Hazard Assessment 60
9.6. Additional Recommendations 62
10. ASSESSMENT OF EARTHQUAKE-GENERATED TSUNAMI INUNDATION BASED ON PROBABILISTIC OFFSHORE TSUNAMI HEIGHT 64
10.1. Background and Objectives 64
10.2. Methodology and Procedure 65
10.2.1. PTHA Offshore Maximum Tsunami Amplitude 65
10.2.2. Tsunami Inundation Model and ComMIT 66
10.2.3. Tsunami Source Inversion and Reconstruction 67
10.2.4. Procedure of Obtaining Probabilistic Tsunami Inundation 68
10.2.5. Relevance for NPPs 69
10.3. Case Study 70
10.3.1. Study Area 70
10.3.2. Development of the 2500-year Tsunami Inundation Zone from the Probabilistic Offshore Tsunami Height 71
11. CONCLUSIONS 85
12. REFERENCES 87
13. GLOSSARY 98
Figure 3.1. Characteristics for water waves in various regimes 22
Figure 3.2. Schematic of wave transformation through refraction, where the change in the blue shading indicates the depth transition 23
Figure 5.1. Various types of movements, as a function of material class (taken from Cruden and Varnes, 1996.) 35
Figure 6.1. Snapshot of the ocean surface elevation as the tsunami travels across the Atlantic 38
Figure 6.2. Snapshot of ocean surface elevation in the nearshore, high-resolution grid 39
Figure 6.3. Maximum elevation (left) and speed (right) predicted by a high resolution simulation 40
Figure 7.1. Initial tsunami condition for an earthquake along the Caribbean Subduction Zone using the deterministic approach 42
Figure 7.2. Initial condition for a tsunami generated by a submarine landslide. The "before" landslide profile is given by the solid yellow surface and the "after" landslide profile is given by the black dashed line. The difference in these two profiles results in the initial... 43
Figure 7.3. Procedural flowchart for a deterministic evaluation of the PMT 47
Figure 7.4. Example procedure tree for the inclusion of slide variability and uncertainty into a PTHA 48
Figure 8.1. Example of source location map including shoreline and bathymetric features 49
Figure 8.2. Sample figure showing bathymetry local to the site of interest 50
Figure 8.3. Sample figure showing initial surface conditions and location of the transect AA' 51
Figure 9.1. Typical ground deformation as computed by Okada's expressions. An area of uplift (hot colors) to the North contiguous to an area of subsidence (cold colors) to the South can be observed 55
Figure 9.2. Distribution of tsunami maximum amplitude at a random coastal location in the Pacific Ocean from each of the potential scenarios extracted from NCTR's propagation data base. A subset of all the scenarios represented can be selected and simulated at... 62
Figure 10.1. 2500-year PTHA source disaggregation for a site (118.36°W, 34.136°N) in California, where the blue bars denote the source contributions to the site indicated by the red circle 67
Figure 10.2. Flow chart of the methodology to assess tsunami inundation based on probabilistic offshore tsunami height 69
Figure 10.3. Aerial photo overlooking Monterey Harbor 71
Figure 10.4. Locations at Monerey Bay, California, where the offshore tsunami heights were obtained (from Thio et al., 2010). The circles are areas of large water depth discrepancies between Thio et al. (2010) and NCTR's tsunami model 73
Figure 10.5. Source disaggregation of 2,500-year offshore tsunami heights at Monterey, California courtesy of Thio et al. (2010). The vertical axis indicates how much each of the sources contributes in percentage, probabilistically, to the tsunami impact at Monterey 74
Figure 10.6. Source selection in Alaska-Aleutian using ComMIT 75
Figure 10.7. Source selection in Kuril-Kamchatka using ComMIT 75
Figure 10.8. Comparison of the 2,500-year offshore tsunami heights for the M9.5 Alaska- Aleutian scenario 76
Figure 10.9. Spectrum analysis of the tsunami waves at all 16 locations where Thio et al. (2010) results are available 78
Figure 10.10. Comparison of the 2500-year offshore tsunami heights for the M9.7 Kuril-Kamchatka scenario 79
Figure 10.11. Computed maximum tsunami wave amplitude in the Pacific due to the M9.5 Alaska-Aleutian source 81
Figure 10.12. Computed maximum tsunami water level along Monterey Bay's coastline due to the M9.5 Alaska-Aleutian source 82
Figure 10.13. Computed maximum tsunami flow speed along Monterey Bay's coastline due to the M9.5 Alaska-Aleutian source 83
Figure 10.14. The 2500-year tsunami inundation zone for Monterey Bay, California 84
*표시는 필수 입력사항입니다.
| 전화번호 |
|---|
| 기사명 | 저자명 | 페이지 | 원문 | 기사목차 |
|---|
| 번호 | 발행일자 | 권호명 | 제본정보 | 자료실 | 원문 | 신청 페이지 |
|---|
도서위치안내: / 서가번호:

우편복사 목록담기를 완료하였습니다.
*표시는 필수 입력사항입니다.
저장 되었습니다.
