 https://www150.statcan.gc.ca/n1/daily-quotidien/210125/dq210125e-eng.htm


권호기사보기
| 기사명 | 저자명 | 페이지 | 원문 | 기사목차 |
|---|
| 대표형(전거형, Authority) | 생물정보 | 이형(異形, Variant) | 소속 | 직위 | 직업 | 활동분야 | 주기 | 서지 | |
|---|---|---|---|---|---|---|---|---|---|
| 연구/단체명을 입력해주세요. | |||||||||
|
|
|
|
|
|
* 주제를 선택하시면 검색 상세로 이동합니다.
Title page
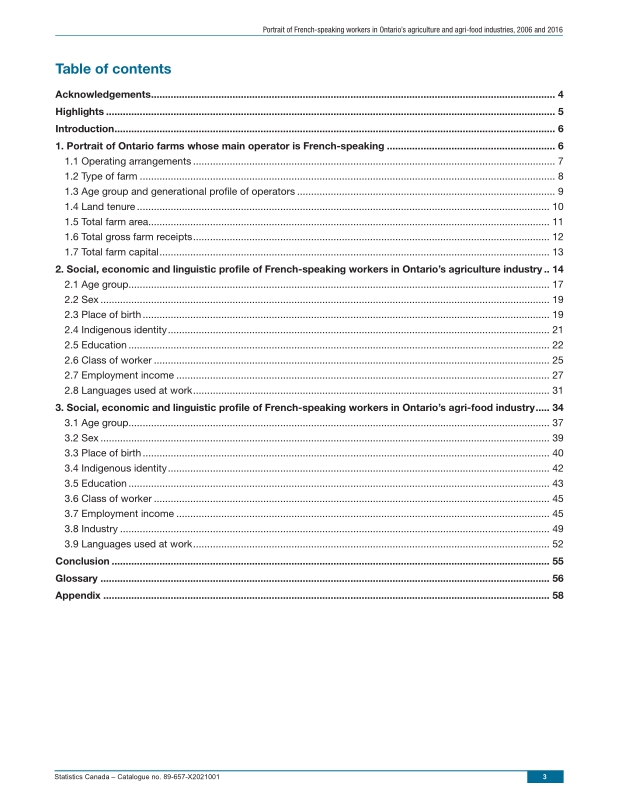
Contents
Acknowledgements 4
Highlights 5
Introduction 6
1. Portrait of Ontario farms whose main operator is French-speaking 6
1.1. Operating arrangements 7
1.2. Type of farm 8
1.3. Age group and generational profile of operators 9
1.4. Land tenure 10
1.5. Total farm area 11
1.6. Total gross farm receipts 12
1.7. Total farm capital 13
2. Social, economic and linguistic profile of French-speaking workers in Ontario's agriculture industry 14
2.1. Age group 17
2.2. Sex 19
2.3. Place of birth 19
2.4. Indigenous identity 21
2.5. Education 22
2.6. Class of worker 25
2.7. Employment income 27
2.8. Languages used at work 31
3. Social, economic and linguistic profile of French-speaking workers in Ontario's agri-food industry 34
3.1. Age group 37
3.2. Sex 39
3.3. Place of birth 40
3.4. Indigenous identity 42
3.5. Education 43
3.6. Class of worker 45
3.7. Employment income 45
3.8. Industry 49
3.9. Languages used at work 52
Conclusion 55
Glossary 56
Appendix 58
Table 1/Table 1.2. Farms classified by farm type and by first official language spoken (FOLS) of the main operator, Ontario, 2016 8
Table 2. First official language spoken (FOLS) of agriculture sector workers aged 15 or over, by census agricultural region, Ontario, 2006 and 2016 14
Table 3. First official language spoken (FOLS) of agri-food sector workers aged 15 or over, by census agricultural region, Ontario, 2006 and 2016 34
Charts
Chart 1.1. Farms classified by operating arrangements and first official language spoken (FOLS) of the main operator, Ontario, 2016 7
Chart 1.2/Chart 1.3. Farms classified by operators' age group and first official language spoken (FOLS) of the main operator, Ontario, 2016 9
Chart 1.3/Chart 1.4. Percentage of farms by land tenure and first official language spoken (FOLS) of the main operator, Ontario, 2016 10
Chart 1.4/Chart 1.5. Farms classified by total farm area and first official language spoken (FOLS) of the main operator, Ontario, 2016 11
Chart 1.5/Chart 1.6. Farms classified by total gross farm receipts and first official language spoken (FOLS) of the main operator, Ontario, 2016 12
Chart 1.6/Chart 1.7. Farms classified by total farm capital and first official language spoken (FOLS) of the main operator, Ontario, 2016 13
Chart 2.1.1. Age group of agriculture sector workers aged 15 or over by first official language spoken (FOLS), Ontario, 2006 and 2016 17
Chart 2.1.2. Age group of agriculture sector workers aged 15 or over by first official language spoken (FOLS), Eastern Ontario census agricultural region, 2006 and 2016 18
Chart 2.1.3. Age group of agriculture sector workers aged 15 or over by first official language spoken (FOLS), Northern Ontario census agricultural region, 2006 and 2016 18
Chart 2.3.1. Place of birth of agriculture sector workers aged 15 or over by first official language spoken (FOLS), Ontario, 2006 and 2016 19
Chart 2.3.2. Place of birth of agriculture sector workers aged 15 or over by first official language spoken (FOLS), Eastern Ontario census agricultural region, 2006 and 2016 20
Chart 2.3.3. Place of birth of agriculture sector workers aged 15 or over by first official language spoken (FOLS), Northern Ontario census agricultural region, 2006 and 2016 21
Chart 2.5.1. Highest certificate, diploma or degree of agriculture sector workers aged 15 or over by first official language spoken (FOLS), Ontario, 2006 and 2016 22
Chart 2.5.2. Highest certificate, diploma or degree of agriculture sector workers aged 15 or over by first official language spoken (FOLS), Eastern Ontario census agricultural region, 2006 and 2016 23
Chart 2.5.3. Highest certificate, diploma or degree of agriculture sector workers aged 15 or over by first official language spoken (FOLS), Northern Ontario census agricultural region, 2006 and 2016 24
Chart 2.6.1. Class of worker of agricultural sector workers aged 15 or over by first official language spoken (FOLS), Ontario, 2006 and 2016 25
Chart 2.6.2. Class of worker of agriculture sector workers aged 15 or over by first official langue spoken (FOLS), Eastern Ontario census agricultural region, 2006 and 2016 26
Chart 2.6.3. Class of worker of agriculture sector workers aged 15 or over by first official language spoken (FOLS), Northern Ontario census agricultural region, 2006 and 2016 27
Chart 2.7.1. Employment income of agriculture sector workers aged 15 or over by first official language spoken (FOLS), Ontario,2006 and 2016 28
Chart 2.7.2. Employment income of agriculture sector workers aged 15 or over by first official language spoken (FOLS), Eastern Ontario census agricultural region, 2006 and 2016 29
Chart 2.7.3. Employment income of agriculture sector workers aged 15 or over by first official language spoken (FOLS), Northern Ontario census agricultural region, 2006 and 2016 30
Chart 2.8.1. Language(s) used at work by agriculture sector workers aged 15 or over by first official language spoken (FOLS), Ontario, 2006 and 2016 31
Chart 2.8.2. Language(s) used at work by agriculture sector workers aged 15 or over by first official language spoken (FOLS), Eastern Ontario census agricultural region, 2006 and 2016 32
Chart 2.8.3. Language(s) used at work by agriculture sector workers aged 15 or over by first official language spoken (FOLS), Northern Ontario census agricultural region, 2006 and 2016 33
Chart 3.1.1. Age group of agri-food sector workers aged 15 or over by first official language spoken (FOLS), Ontario, 2006 and 2016 37
Chart 3.1.2. Age group of agri-food sector workers aged 15 or over by first official language spoken (FOLS), Eastern Ontario census agricultural region, 2006 and 2016 38
Chart 3.1.3. Age group of agri-food sector workers aged 15 or over by first official language spoken (FOLS), Northern Ontario census agricultural region, 2006 and 2016 39
Chart 3.3.1. Place of birth of agri-food sector workers aged 15 or over by first official language spoken (FOLS), Ontario, 2006 and 2016 40
Chart 3.3.2. Place of birth of agri-food sector workers aged 15 or over by first official language spoken (FOLS), Eastern Ontario census agricultural region, 2006 and 2016 41
Chart 3.3.3. Place of birth of agri-food sector workers aged 15 or over by first official language spoken (FOLS), Northern Ontario census agricultural region, 2006 and 2016 42
Chart 3.5.1. Highest certificate, diploma or degree of agri-food sector workers aged 15 or over by first official language spoken (FOLS), Ontario, 2006 and 2016 43
Chart 3.5.2. Highest certificate, diploma or degree of agri-food sector workers aged 15 or over by first official language spoken (FOLS), Eastern Ontario census agricultural region, 2006 and 2016 44
Chart 3.5.3. Highest certificate, diploma or degree of agri-food sector workers aged 15 or over by first official language spoken (FOLS), Northern Ontario census agricultural region, 2006 and 2016 45
Chart 3.7.2. Employment income of agri-food sector workers aged 15 or over by first official language spoken (FOLS), Eastern Ontario census agricultural region, 2006 and 2016 47
Chart 3.7.3. Employment income of agri-food sector workers aged 15 or over by first official language spoken (FOLS), Northern Ontario census agricultural region, 2006 and 2016 48
Chart 3.8.1. Industry of agri-food sector workers aged 15 or over by first official language spoken (FOLS), Ontario, 2006 and 2016 49
Chart 3.8.2. Industry of agri-food sector workers aged 15 or over by first official language spoken (FOLS), Eastern Ontario census agricultural region, 2006 and 2016 50
Chart 3.8.3. Industry of agri-food sector workers aged 15 or over by first official language spoken (FOLS), Northern Ontario census agricultural region, 2006 and 2016 51
Chart 3.9.1. Language(s) used at work by agri-food sector workers aged 15 or over by first official language spoken (FOLS), Ontario, 2006 and 2016 52
Chart 3.9.2. Language(s) used at work by agri-food sector workers aged 15 or over by first official language spoken (FOLS), Eastern Ontario census agricultural region, 2006 and 2016 53
Chart 3.9.3. Language(s) used at work by agri-food sector workers aged 15 or over by first official language spoken (FOLS), Northern Ontario census agricultural region, 2006 and 2016 54
Maps
Map 2.a. Percentage change from 2006 to 2016 of the French-speaking population aged 15 or over who worked in the agriculture sector, Ontario census agricultural regions (CARs) 15
Map 2.b. Number of French-speaking agriculture sector workers aged 15 or over, Ontario census subdivisions (CSDs), 2016 16
Map 3.a. Percentage change from 2006 to 2016 of the French-speaking population aged 15 or over who worked in the agri-food sector, Ontario census agricultural regions (CARs) 35
Map 3.b. Number of French-speaking agri-food sector workers aged 15 or over, Ontario census subdivisions (CSDs), 2016 36
Table A.1. List of industries in the agriculture sector, 2006 and 2016 58
Table A.2. List of industries in the agri-food sector, 2006 and 2016 59
*표시는 필수 입력사항입니다.
| *전화번호 | ※ '-' 없이 휴대폰번호를 입력하세요 |
|---|
| 기사명 | 저자명 | 페이지 | 원문 | 기사목차 |
|---|
| 번호 | 발행일자 | 권호명 | 제본정보 | 자료실 | 원문 | 신청 페이지 |
|---|
도서위치안내: / 서가번호:

우편복사 목록담기를 완료하였습니다.
*표시는 필수 입력사항입니다.
저장 되었습니다.
