 https://www.census.gov/library/publications/2022/acs/acs-50.html


권호기사보기
| 기사명 | 저자명 | 페이지 | 원문 | 기사목차 |
|---|
| 대표형(전거형, Authority) | 생물정보 | 이형(異形, Variant) | 소속 | 직위 | 직업 | 활동분야 | 주기 | 서지 | |
|---|---|---|---|---|---|---|---|---|---|
| 연구/단체명을 입력해주세요. | |||||||||
|
|
|
|
|
|
* 주제를 선택하시면 검색 상세로 이동합니다.
Contents
INTRODUCTION 1
A HISTORICAL LOOK AT LANGUAGES SPOKEN IN THE UNITED STATES 2
TRENDS IN ENGLISH ABILITY 4
LANGUAGES SPOKEN 6
ENGLISH-SPEAKING ABILITY 7
HOUSEHOLD CHARACTERISTICS BY HOUSEHOLD LANGUAGE AND LANGUAGE SPOKEN OVER GENERATIONS 9
LANGUAGE SPOKEN BY SELECTED SOCIAL AND DEMOGRAPHIC CHARACTERISTICS 13
ENGLISH ABILITY BY SELECTED SOCIAL AND DEMOGRAPHIC CHARACTERISTICS 16
LANGUAGE CONCENTRATIONS BY STATE 18
LANGUAGES SPOKEN IN METROPOLITAN AREAS 20
SUMMARY 24
SOURCE OF THE DATA 24
ACCURACY OF THE ESTIMATES 25
MORE INFORMATION 25
APPENDIX A. LANGUAGE QUESTIONS USED IN DECENNIAL CENSUSES 26
APPENDIX B 27
APPENDIX C 29
Table 1. Languages Spoken at Home for the Population 5 Years and Over: 1980, 1990, 2000, 2010, and 2019 3
Table 2. Detailed Languages Spoken at Home by English-Speaking Ability for the Population 5 Years and Over: 2019 8
Table 3. Household Language and Limited English-Speaking Status by Household Characteristics: 2019 10
Table 4a. Languages Spoken at Home by Selected Demographic and Social Characteristics for the Population 5 Years and Over: 2019 14
Table 4b. Languages Spoken at Home by Selected Demographic and Social Characteristics for the Population 5 Years and Over: 2019 15
Table 5. Languages Spoken at Home by English-Speaking Ability and Selected Demographic and Social Characteristics for the Population 5 Years and Over: 2019 17
Table 6. Distribution of Speakers of Non-English Languages for the 50 Most Populous Metropolitan Areas: 2019 21
Figure 1. Reproduction of the Questions on Language From the 2019 American Community Survey 1
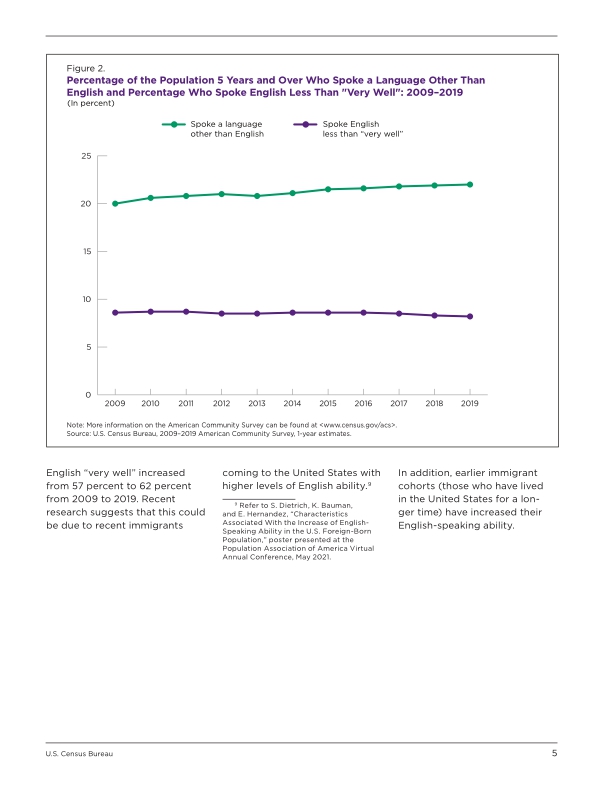
Figure 2. Percentage of the Population 5 Years and Over Who Spoke a Language Other Than English and Percentage Who Spoke English Less Than "Very Well":... 5
Figure 3. Percentage of Households With Limited English Speakers by Household Language: 2019 9
Figure 4. Percentage of Children Aged 5 to 17 Who Spoke the Household's Non-English Language by Household Language: 2019 11
Figure 5. Trajectory of Children's English-Learning Ability by Nativity, Age of Entry, and Time in the United States 12
Figure 6. Percentage of Population 5 Years and Over Who Spoke a Language Other Than English at Home: 2019 18
Figure 7. Percent Change in Population 5 Years and Over Who Spoke a Language Other Than English at Home: 2010-2019 19
Appendix Table B-1. Percentage of People 5 Years and Over Who Spoke a Language Other Than English at Home by State: 2019 27
Appendix Table B-2. Percent Change in the Population 5 Years and Over Who Spoke a Language Other Than English at Home by State: 2010-2019 28
Appendix Table C-1. Margins of Error for Table 1: Languages Spoken at Home for the Population 5 Years and Over: 1980, 1990, 2000, 2010, and 2019 29
Appendix Table C-2. Margins of Error for Table 2: Detailed Languages Spoken at Home by English-Speaking Ability for the Population 5 Years and Over: 2019 30
Appendix Table C-3. Margins of Error for Table 3: Household Language and Limited English-Speaking Status by Household Characteristics: 2019 31
Appendix Table C-4a. Margins of Error for Table 4a: Languages Spoken at Home by Selected Demographic and Social Characteristics for the Population 5 Years... 32
Appendix Table C-4b. Margins of Error for Table 4b: Languages Spoken at Home by Selected Demographic and Social Characteristics for the Population 5 Years... 33
Appendix Table C-5. Margins of Error for Table 5: Languages Spoken at Home by English-Speaking Ability and Selected Demographic and Social Characteristics... 34
Appendix Table C-6. Margins of Error for Table 6: The Distribution of Speakers of Non-English Languages for the 50 Most Populous Metropolitan Areas: 2019 35
*표시는 필수 입력사항입니다.
| *전화번호 | ※ '-' 없이 휴대폰번호를 입력하세요 |
|---|
| 기사명 | 저자명 | 페이지 | 원문 | 기사목차 |
|---|
| 번호 | 발행일자 | 권호명 | 제본정보 | 자료실 | 원문 | 신청 페이지 |
|---|
도서위치안내: / 서가번호:

우편복사 목록담기를 완료하였습니다.
*표시는 필수 입력사항입니다.
저장 되었습니다.
