
 대표어
대표어
 https://www.accc.gov.au/about-us/publications/serial-publications/domestic-airline-competition-monitoring-reports/domestic-airline-competition-in-australia-february-2024
권호기사보기
| 기사명 | 저자명 | 페이지 | 원문 | 기사목차 |
|---|
결과 내 검색
동의어 포함
Title page
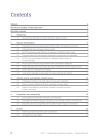
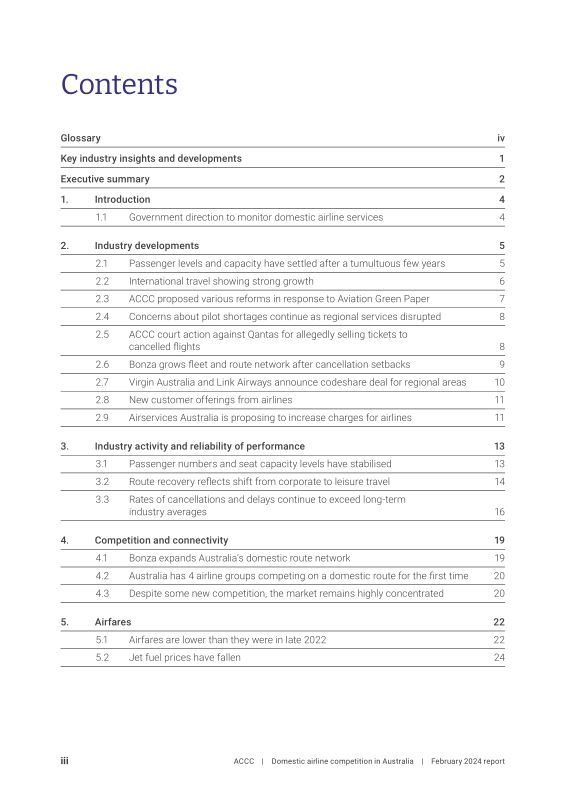
Contents
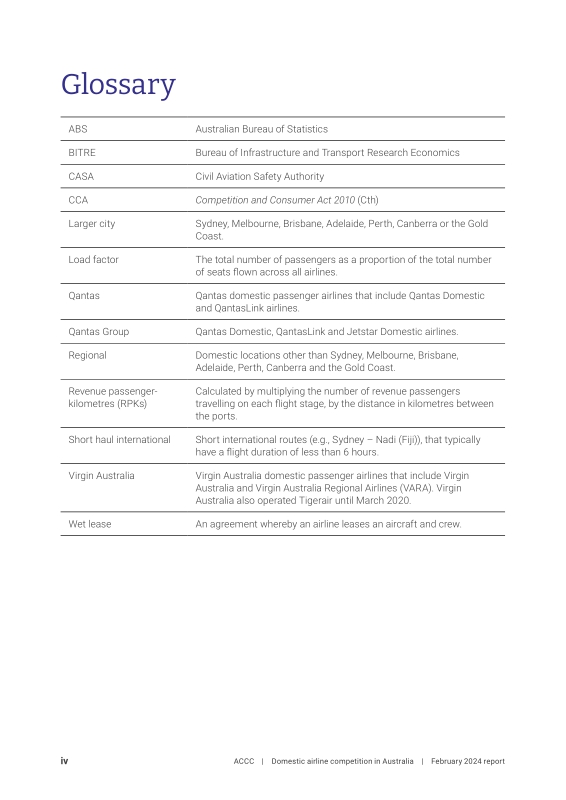
Glossary 4
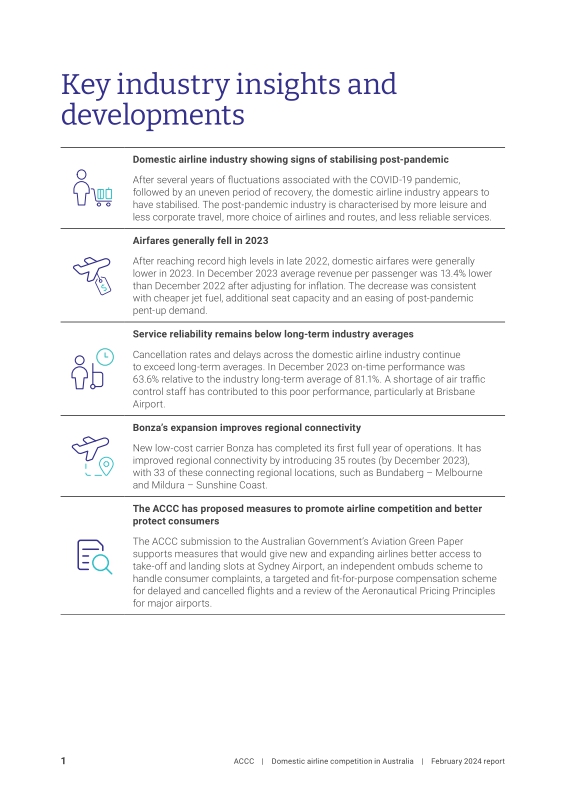
Key industry insights and developments 5
Executive summary 6
1. Introduction 8
1.1. Government direction to monitor domestic airline services 8
2. Industry developments 9
2.1. Passenger levels and capacity have settled after a tumultuous few years 9
2.2. International travel showing strong growth 10
2.3. ACCC proposed various reforms in response to Aviation Green Paper 11
2.4. Concerns about pilot shortages continue as regional services disrupted 12
2.5. ACCC court action against Qantas for allegedly selling tickets to cancelled flights 12
2.6. Bonza grows fleet and route network after cancellation setbacks 13
2.7. Virgin Australia and Link Airways announce codeshare deal for regional areas 14
2.8. New customer offerings from airlines 15
2.9. Airservices Australia is proposing to increase charges for airlines 15
3. Industry activity and reliability of performance 17
3.1. Passenger numbers and seat capacity levels have stabilised 17
3.2. Route recovery reflects shift from corporate to leisure travel 18
3.3. Rates of cancellations and delays continue to exceed long-term industry averages 20
4. Competition and connectivity 23
4.1. Bonza expands Australia's domestic route network 23
4.2. Australia has 4 airline groups competing on a domestic route for the first time 24
4.3. Despite some new competition, the market remains highly concentrated 24
5. Airfares 26
5.1. Airfares are lower than they were in late 2022 26
5.2. Jet fuel prices have fallen 28
Figure 1. Australian domestic air services - January 2019 to December 2023 17
Figure 2. Passengers and seat capacity as a proportion of 2019 levels - January 2021 to December 2023 18
Figure 3. Passengers on routes connecting larger cities - December 2019 compared to December 2023 19
Figure 4. Busiest routes by monthly passengers - December 2023 19
Figure 5. Airline cancellation rates - January 2022 to December 2023 20
Figure 6. Airline on-time performance rates (arrivals) - January 2022 to December 2023 21
Figure 7. Number of domestic routes operated by airlines - January 2021 to December 2023 23
Figure 8. Share of passengers on routes serviced by 1, 2, 3 and 4 airline groups - January 2021 to December 2023 24
Figure 9. Airline passenger market shares across all domestic routes - January 2021 to December 2023 25
Figure 10. Index of average fare revenue per passenger - January 2019 to December 2023 26
Figure 11. Real price index of the best discount economy airfares - January 2019 to January 2024 27
Figure 12. Real jet fuel and Brent crude oil prices - January 2019 to December 2023 28
*표시는 필수 입력사항입니다.
| 전화번호 |
|---|
| 기사명 | 저자명 | 페이지 | 원문 | 기사목차 |
|---|
| 번호 | 발행일자 | 권호명 | 제본정보 | 자료실 | 원문 | 신청 페이지 |
|---|
도서위치안내: / 서가번호:

우편복사 목록담기를 완료하였습니다.
*표시는 필수 입력사항입니다.
저장 되었습니다.
