 https://www.bruegel.org/working-paper/global-supply-chains-lessons-decade-disruption
권호기사보기
| 기사명 | 저자명 | 페이지 | 원문 | 기사목차 |
|---|
| 대표형(전거형, Authority) | 생물정보 | 이형(異形, Variant) | 소속 | 직위 | 직업 | 활동분야 | 주기 | 서지 | |
|---|---|---|---|---|---|---|---|---|---|
| 연구/단체명을 입력해주세요. | |||||||||
|
|
|
|
|
|
* 주제를 선택하시면 검색 상세로 이동합니다.
Title page
Contents
1. Introduction 3
2. COVID-19 3
2.1. Timeline of economic effects 4
2.2. Price volatility and shortages 7
2.3. Policy responses and the aftermath 8
3. The Russian invasion of Ukraine 9
3.1. Energy shock 9
3.2. Agriculture 13
3.3. In perspective: the shock and the response 18
4. The China-US trade war 19
4.1. The Trump-Biden trade wars 19
4.2. The chip wars 20
4.3. The impact 21
5. Policy lessons from a decade of trade shocks 23
References 24
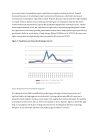
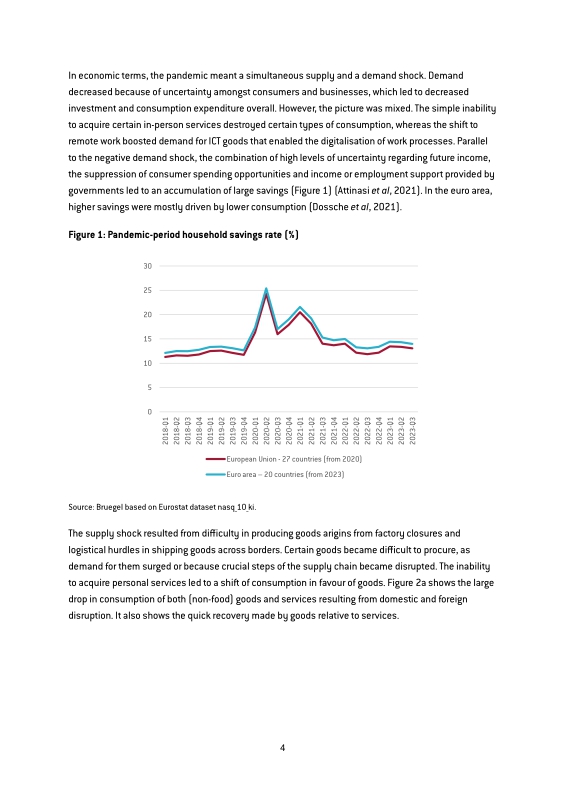
Figure 1. Pandemic-period household savings rate 5
Figure 2. Pandemic retail turnover of non-food products (except fuel) and services in the EU27 6
Figure 3. Freight rates 7
Figure 4. Used versus new cars CPI, United States 8
Figure 5. Last price TTF futures 10
Figure 6. European vs US natural gas prices 11
Figure 7. Energy subsidies by economic sector in the EU27, € billions (2022 prices), 2015-2022 12
Figure 8. Change in EU industrial output: Q3 2022 vs Q3 2021 13
Figure 9. Wheat futures 14
Figure 10. Fertiliser prices 15
Figure 11. Wheat and wheat flour prices on the world market and in China, India and Indonesia (January 2018 = 100) 16
Figure 12. Evolution of the share of global trade, in calories, impacted by export restrictions 16
Figure 13. Wheat and grain prices (January 2000 = 100) 18
Figure 14. The US-China trade war: US-China tariff rates toward each other 19
Figure 15. Chinese imports of integrated circuits vs crude oil 21
*표시는 필수 입력사항입니다.
| 전화번호 |
|---|
| 기사명 | 저자명 | 페이지 | 원문 | 기사목차 |
|---|
| 번호 | 발행일자 | 권호명 | 제본정보 | 자료실 | 원문 | 신청 페이지 |
|---|
도서위치안내: / 서가번호:

우편복사 목록담기를 완료하였습니다.
*표시는 필수 입력사항입니다.
저장 되었습니다.
