
 대표어
대표어
 https://www.accc.gov.au/about-us/publications/serial-publications/australian-petroleum-industry-quarterly-reports/quarterly-report-on-the-australian-petroleum-market-december-quarter-2023

권호기사보기
| 기사명 | 저자명 | 페이지 | 원문 | 기사목차 |
|---|
결과 내 검색
동의어 포함
Title page
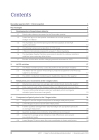
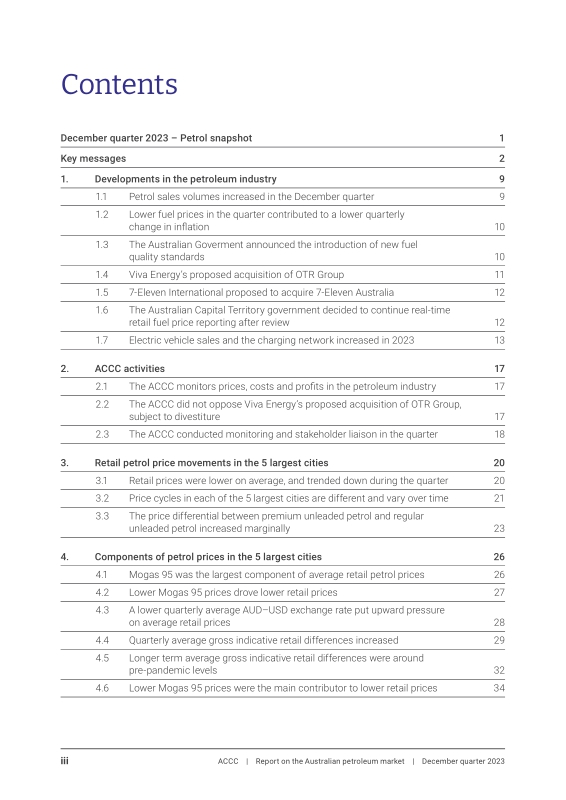
Contents
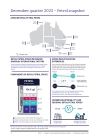
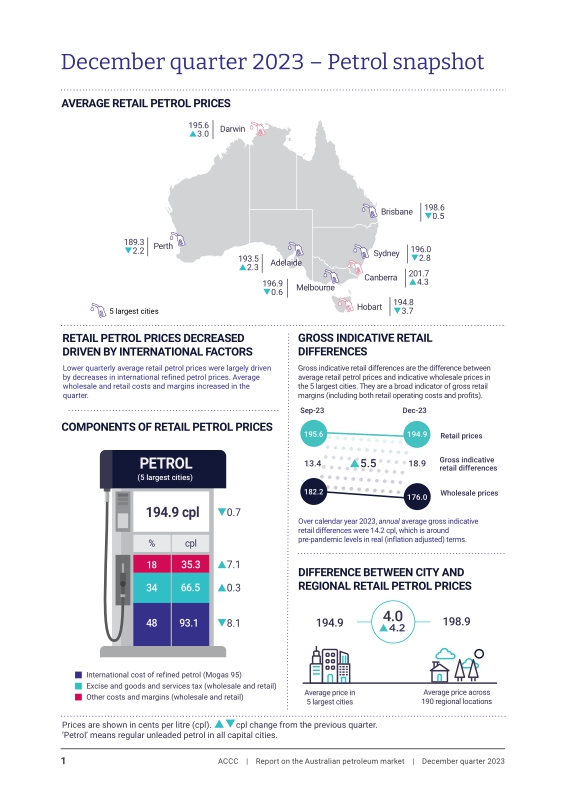
December quarter 2023 - Petrol snapshot 5
Key messages 6
1. Developments in the petroleum industry 13
1.1. Petrol sales volumes increased in the December quarter 13
1.2. Lower fuel prices in the quarter contributed to a lower quarterly change in inflation 14
1.3. The Australian Goverment announced the introduction of new fuel quality standards 14
1.4. Viva Energy's proposed acquisition of OTR Group 15
1.5. 7-Eleven International proposed to acquire 7-Eleven Australia 16
1.6. The Australian Capital Territory government decided to continue real-time retail fuel price reporting after review 16
1.7. Electric vehicle sales and the charging network increased in 2023 17
2. ACCC activities 21
2.1. The ACCC monitors prices, costs and profits in the petroleum industry 21
2.2. The ACCC did not oppose Viva Energy's proposed acquisition of OTR Group, subject to divestiture 21
2.3. The ACCC conducted monitoring and stakeholder liaison in the quarter 22
3. Retail petrol price movements in the 5 largest cities 24
3.1. Retail prices were lower on average, and trended down during the quarter 24
3.2. Price cycles in each of the 5 largest cities are different and vary over time 25
3.3. The price differential between premium unleaded petrol and regular unleaded petrol increased marginally 27
4. Components of petrol prices in the 5 largest cities 30
4.1. Mogas 95 was the largest component of average retail petrol prices 30
4.2. Lower Mogas 95 prices drove lower retail prices 31
4.3. A lower quarterly average AUD-USD exchange rate put upward pressure on average retail prices 32
4.4. Quarterly average gross indicative retail differences increased 33
4.5. Longer term average gross indicative retail differences were around pre-pandemic levels 36
4.6. Lower Mogas 95 prices were the main contributor to lower retail prices 38
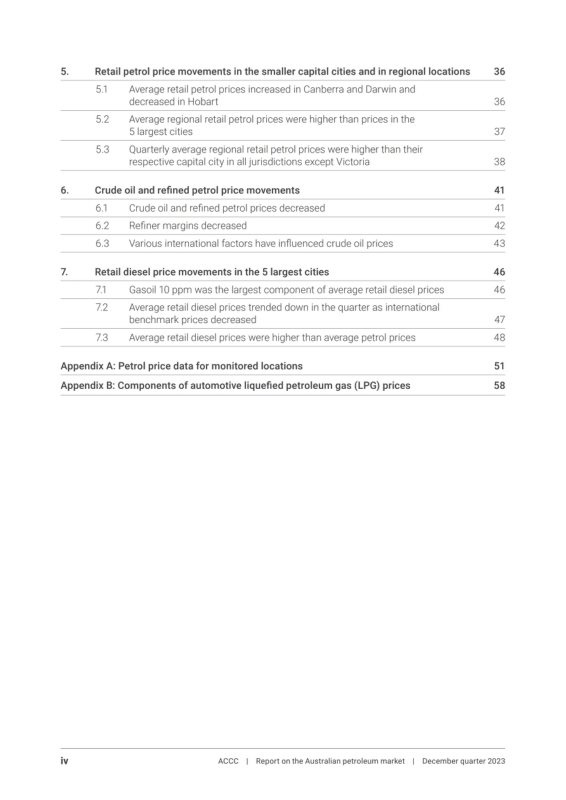
5. Retail petrol price movements in the smaller capital cities and in regional locations 40
5.1. Average retail petrol prices increased in Canberra and Darwin and decreased in Hobart 40
5.2. Average regional retail petrol prices were higher than prices in the 5 largest cities 41
5.3. Quarterly average regional retail petrol prices were higher than their respective capital city in all jurisdictions except Victoria 42
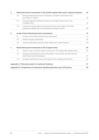
6. Crude oil and refined petrol price movements 45
6.1. Crude oil and refined petrol prices decreased 45
6.2. Refiner margins decreased 46
6.3. Various international factors have influenced crude oil prices 47
7. Retail diesel price movements in the 5 largest cities 50
7.1. Gasoil 10 ppm was the largest component of average retail diesel prices 50
7.2. Average retail diesel prices trended down in the quarter as international benchmark prices decreased 51
7.3. Average retail diesel prices were higher than average petrol prices 52
Appendix A: Petrol price data for monitored locations 55
Appendix B: Components of automotive liquefied petroleum gas (LPG) prices 62
Figure 2.1. Fuel-related inquiries and ACCC web page views - December quarter 2023 23
Figure 5.1. Quarterly average differential between retail petrol prices in regional locations in the states and the Northern Territory and their respective capital city:... 43
Figure 5.2. Annual average differential between retail petrol prices in regional locations in the states and the Northern Territory and their respective capital city:... 44
Figure 6.1. Key influences on crude oil prices since January 2022 - USD per barrel 48
Charts
Chart 1.1. Quarterly sales volumes of regular unleaded petrol in Australia: March quarter 2019 to December quarter 2023 - million litres 13
Chart 1.2. Quarterly new battery electric vehicle sales and new plug-in hybrid electric vehicle sales: March quarter 2022 to December quarter 2023 18
Chart 3.1. Seven-day rolling average retail petrol prices in the 5 largest cities in nominal terms: 1 January 2022 to 31 December 2023 - cents per litre (cpl) 25
Chart 3.2. Daily average retail petrol prices in Sydney, Melbourne and Brisbane: 1 October to 31 December 2023 - cents per litre (cpl) 26
Chart 3.3. Daily average retail petrol prices in Adelaide and Perth: 1 October to 31 December 2023 - cents per litre (cpl) 26
Chart 3.4. Monthly average retail prices of regular unleaded petrol, premium unleaded petrol 95 and 98 and E10 in the 5 largest cities in nominal terms: January 2022... 28
Chart 4.1. Components of average retail petrol prices in the 5 largest cities in the December quarter 2023 - in percentage and cents per litre (cpl) terms 30
Chart 4.2. Monthly average retail petrol prices in the 5 largest cities and Mogas 95 prices in nominal terms: January 2022 to December 2023 - cents per litre (cpl) 31
Chart 4.3. Daily AUD-USD exchange rates in nominal terms: 3 January 2022 to 29 December 2023 - US cents 32
Chart 4.4. Quarterly average gross indicative retail differences in the 5 largest cities in nominal terms: March quarter 2021 to December quarter 2023 - cents per litre (cpl) 35
Chart 4.5. Twelve-month average gross indicative retail differences in the 5 largest cities in real terms: March 2017 to December 2023 - cents per litre (cpl) 37
Chart 4.6. Changes in the components of average retail petrol prices in the 5 largest cities: September quarter 2023 to December quarter 2023 - cents per litre (cpl) 38
Chart 5.1. Monthly average retail petrol prices in Canberra, Hobart, Darwin and the 5 largest cities in nominal terms: January 2022 to December 2023 - cents per litre (cpl) 41
Chart 5.2. Monthly average retail petrol prices in regional locations in aggregate and the 5 largest cities in nominal terms: January 2022 to December 2023 - cents per litre (cpl) 42
Chart 6.1. Weekly average Brent crude oil and Mogas 95 prices in nominal terms: January 2022 to December 2023 - USD per barrel 45
Chart 7.1. Components of average retail diesel prices in the 5 largest cities in the December quarter 2023 - in percentage and cents per litre (cpl) terms 50
Chart 7.2. Seven-day rolling average retail diesel prices in the 5 largest cities and Gasoil 10 ppm prices in nominal terms: 1 January 2022 to 31 December 2023... 51
Chart 7.3. Monthly average retail diesel prices and retail petrol prices in the 5 largest cities in nominal terms: January 2022 to December 2023 - cents per litre (cpl) 52
Chart 7.4. Monthly average Gasoil 10 ppm and Mogas 95 prices in nominal terms: January 2022 to December 2023 - cents per litre (cpl) 53
Appendix Charts
Chart B.1. Components of average retail liquefied petroleum gas (LPG) prices in the 5 largest cities in the December quarter 2023 - in percentage and cents per litre (cpl) terms 62
*표시는 필수 입력사항입니다.
| 전화번호 |
|---|
| 기사명 | 저자명 | 페이지 | 원문 | 기사목차 |
|---|
| 번호 | 발행일자 | 권호명 | 제본정보 | 자료실 | 원문 | 신청 페이지 |
|---|
도서위치안내: / 서가번호:

우편복사 목록담기를 완료하였습니다.
*표시는 필수 입력사항입니다.
저장 되었습니다.
