
 대표어
대표어
 https://www.census.gov/library/working-papers/2024/adrm/CES-WP-24-11.html
권호기사보기
| 기사명 | 저자명 | 페이지 | 원문 | 기사목차 |
|---|
결과 내 검색
동의어 포함
Title page
Contents
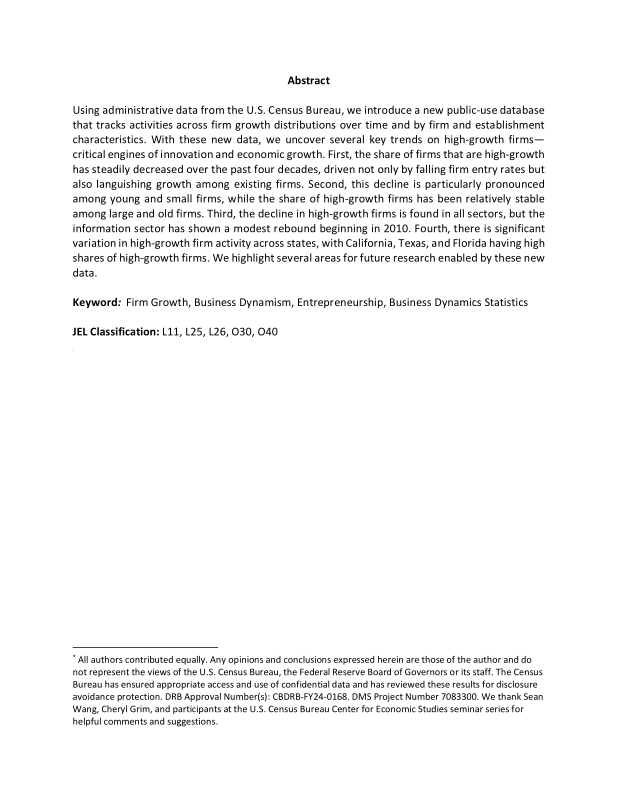
Abstract 2
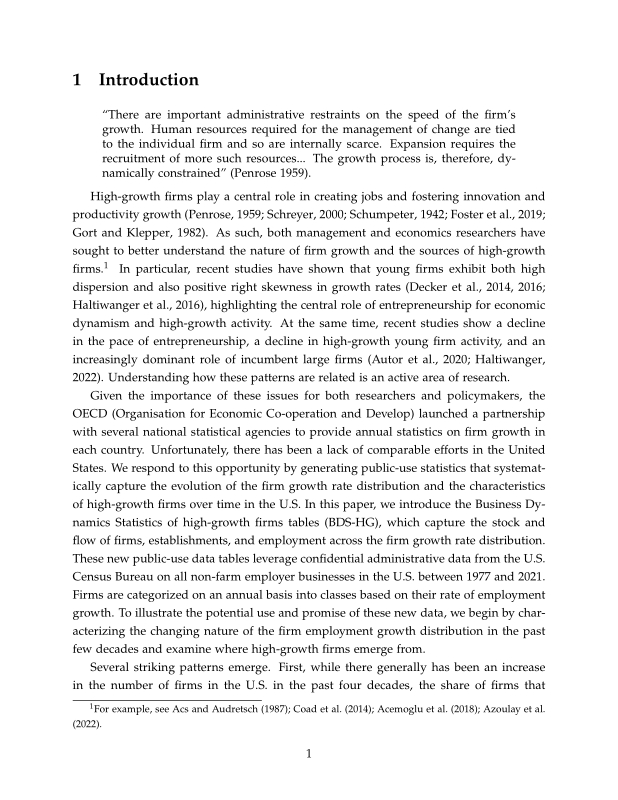
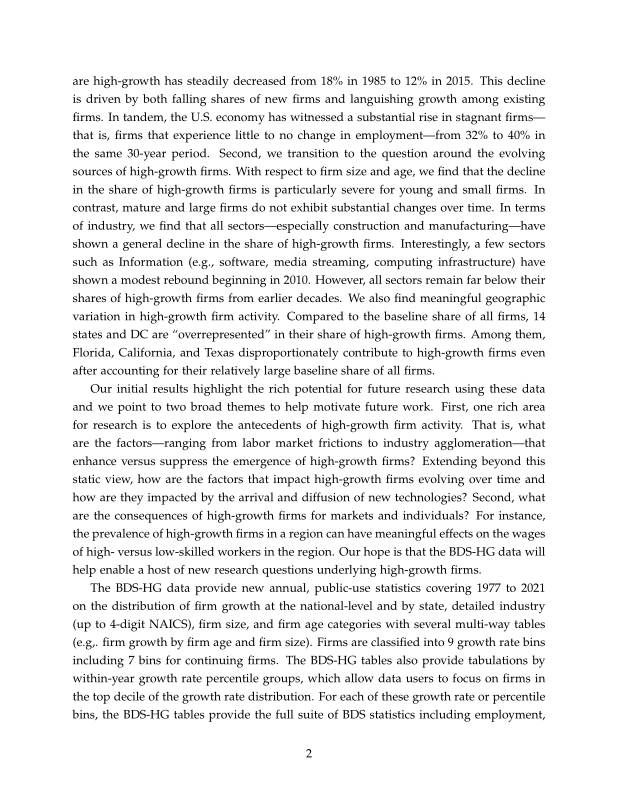
1. Introduction 3
2. Data and Methodology 5
2.1. OECD Approach 6
2.2. BDS High-Growth Approach 7
3. Trends in High-Growth Firm Activity 14
4. Conclusion 25
References 27
Online Appendix for High-Growth Firms in the United States: Key Trends and New Data Opportunities 30
Figure 1. Firm growth rates by percentile over time 10
Figure 2. Detailed Distribution of Firm Growth Rates, 1980 vs. 2018 12
Figure 3. High-Growth Firm Shares 13
Figure 4. Rise of stagnant firms over time 16
Figure 5. Net Job Creation by Firm Growth Bins 17
Figure 6. Intensity of High-Growth Firms by Firm Maturity 19
Figure 7. Intensity of High-Growth Firms by Small, Medium, and Large Firms 20
Figure 8. Share of Employment from High-Growth Firms by Size and Age 21
Figure 9. Intensity of High-Growth Firms by Industry 22
Figure 10. State's Share of High-Growth Firms versus Share of All Firms 24
Figure 11. Change in High-Growth Firm Share by State in 2000 versus 2020 25
Figure A1. TVV/DHS, Log Differences, and Firm Size 32
Figure A2. Firm Growth and Change in Firm Counts, Average Size Minus Initial Size 33
Figure A3. Establishment Growth and Mean Reversion 34
Figure A4. Firm Growth Distribution and Firm Age 36
Figure A5. Asymmetry of Firm Growth Distribution and Firm Age 37
Figure A6. Firm Growth and Firm Age, Continuers 38
Figure A7. Firm Growth, Firm Age, and Change in Firm Counts, Average Size Minus Initial Size 39
*표시는 필수 입력사항입니다.
| 전화번호 |
|---|
| 기사명 | 저자명 | 페이지 | 원문 | 기사목차 |
|---|
| 번호 | 발행일자 | 권호명 | 제본정보 | 자료실 | 원문 | 신청 페이지 |
|---|
도서위치안내: / 서가번호:

우편복사 목록담기를 완료하였습니다.
*표시는 필수 입력사항입니다.
저장 되었습니다.
