 https://www.cgdev.org/publication/forecasting-fallout-amr-economic-impacts-antimicrobial-resistance-humans


권호기사보기
| 기사명 | 저자명 | 페이지 | 원문 | 기사목차 |
|---|
| 대표형(전거형, Authority) | 생물정보 | 이형(異形, Variant) | 소속 | 직위 | 직업 | 활동분야 | 주기 | 서지 | |
|---|---|---|---|---|---|---|---|---|---|
| 연구/단체명을 입력해주세요. | |||||||||
|
|
|
|
|
|
* 주제를 선택하시면 검색 상세로 이동합니다.
Title page
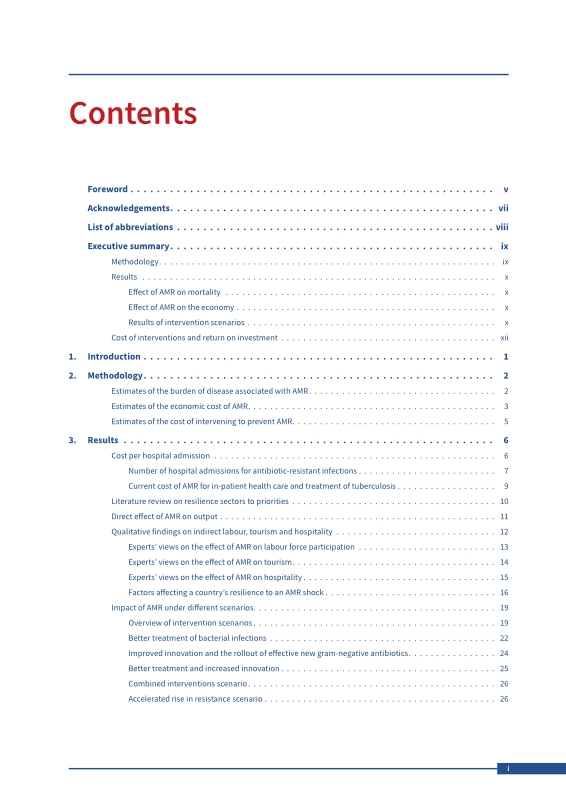
Contents
Foreword 8
Acknowledgements 10
List of abbreviations 11
Executive summary 12
METHODOLOGY 12
RESULTS 13
Effect of AMR on mortality 13
Effect of AMR on the economy 13
Results of intervention scenarios 13
COST OF INTERVENTIONS AND RETURN ON INVESTMENT 15
CHAPTER 1. Introduction 16
CHAPTER 2. Methodology 17
ESTIMATES OF THE BURDEN OF DISEASE ASSOCIATED WITH AMR 17
ESTIMATES OF THE ECONOMIC COST OF AMR 18
ESTIMATES OF THE COST OF INTERVENING TO PREVENT AMR 20
CHAPTER 3. Results 21
COST PER HOSPITAL ADMISSION 21
Number of hospital admissions for antibiotic-resistant infections 22
Current cost of AMR for in-patient health care and treatment of tuberculosis 24
LITERATURE REVIEW ON RESILIENCE SECTORS TO PRIORITIES 25
DIRECT EFFECT OF AMR ON OUTPUT 26
QUALITATIVE FINDINGS ON INDIRECT LABOUR, TOURISM AND HOSPITALITY 27
Experts' views on the effect of AMR on labour force participation 28
Experts' views on the effect of AMR on tourism 29
Experts' views on the effect of AMR on hospitality 30
Factors affecting a country's resilience to an AMR shock 31
IMPACT OF AMR UNDER DIFFERENT SCENARIOS 34
Overview of intervention scenarios 34
Better treatment of bacterial infections 37
Improved innovation and the rollout of effective new gram-negative antibiotics 39
Better treatment and increased innovation 40
Combined interventions scenario 41
Accelerated rise in resistance scenario 41
RETURN ON INVESTMENT 44
Return on investment in improved treatment of bacterial infections 44
Return on investment in increased access to new drugs 44
Return on investment in vaccination and intervention 45
Return on investment in WASH interventions 45
Cost-effectiveness of improving health treatment and innovation of new antimicrobials 45
CHAPTER 4. Discussion 47
COMPARISON WITH OTHER STUDIES 47
Health care costs 47
Macroeconomic burden 47
GDP-based health valuation 48
STRENGTHS AND LIMITATIONS OF THIS STUDY 48
Scope 48
Health cost model 49
Resilience model 49
Macroeconomic model 49
Implementation cost model 50
POLICY IMPLICATIONS 50
References 51
Annex A. Experts who completed the study survey and interview 55
TABLE E.1. Deaths averted, health care cost savings, macroeconomic benefits and a GDP-based health valuation in 2050 under five AMR scenarios (in billion... 14
TABLE 3.1. Projected morbidity caused by AMR in 2030 in all countries, in the business-as-usual scenario 27
TABLE 3.2. Correlation between resilience responses generated from different experts, using 2030 data 32
TABLE 3.3. Correlation between changes in AMR death rate and resilience, by sector 33
TABLE 3.4. Deaths averted, health care cost savings, macroeconomic benefits and a GDP-based health valuation in 2050 under five AMR scenarios (in billion... 36
TABLE 3.5. Economic impacts in 2030, 2040 and 2050 of better treatment of bacterial infections 38
TABLE 3.6. Sectors driving the macroeconomic shock in 2050 from better treatment of bacterial infections in all countries 38
TABLE 3.7. Economic impacts in 2030, 2040 and 2050 of improving innovation and rolling out gram-negative antibiotics 39
TABLE 3.8. Sectors driving the macroeconomic shock associated with increased innovation and the rollout of effective new gram-negative antibiotics in all countries... 40
TABLE 3.9. Economic impacts in 2030, 2040 and 2050 of improving treatment and innovation 40
TABLE 3.10. Sectors driving the macroeconomic change associated with improving treatment and innovation 41
TABLE 3.11. Economic impacts in 2030, 2040 and 2050 of the combined scenario 42
TABLE 3.12. Sectors driving the macroeconomic changes associated with improving treatment and innovation 42
TABLE 3.13. Economic impacts in 2030, 2040 and 2050 of the accelerated rise in resistance scenario 43
TABLE 3.14. Sectors driving the macroeconomic changes associated with the accelerated rise in resistance scenario 43
TABLE 3.15. Average cost of in-patient and out-patient antibiotics and health care, by World Bank income group (US$ at 2022 value, in millions) 44
TABLE 3.16. Estimated annual costs and benefits of improving treatment and innovation in 2050, by World Bank income group (US$ at 2022 value, in billions,... 46
TABLE 4.1. Comparison of returns on investment of interventions in Bonniefield and Towse (2022) and this report 48
FIGURE E.1. Per cent and total GDP impact in 2050 due to improved treatment and innovation (in billion US$) 14
FIGURE E.2. Estimated annual costs (in US$) and benefits in 2050 of better treatment for bacterial infections and innovative new gram-negative drugs 15
FIGURE 2.1. Workstreams used to estimate the health burden of AMR 17
FIGURE 3.1. Cost per antibiotic-resistant admission, by syndrome and World Bank income group 21
FIGURE 3.2. Excess cost per antibiotic-resistant hospital admission, by syndrome and World Bank income group 22
FIGURE 3.3. Cost per hospital admission of antibiotic-resistant and antibiotic-susceptible infections, and ratio of those resistant to susceptible infections,... 23
FIGURE 3.4. Percentage of hospital admissions that involve an antibiotic-resistant infection, by World Bank income group 23
FIGURE 3.5. Estimated direct excess cost associated with hospital admissions for antibiotic-resistant infections, by World Bank income group (US$ billions) 24
FIGURE 3.6. Percentage of in-patient health care costs associated with antibiotic-resistant infections in 2022, by World Bank income group 25
FIGURE 3.7. Experts' estimates of impact of eight-fold increase in AMR on indirect labour, tourism and hospitality 28
FIGURE 3.8. Experts' estimates of the effect of AMR on labour force participation 29
FIGURE 3.9. Experts' estimates of the effect of AMR on tourism if all countries are affected equally 30
FIGURE 3.10. Experts' estimates of effect of AMR on tourism in a country in which resistance rates rise while resistance remains stable in other countries 30
FIGURE 3.11. Experts' estimates of the effect of AMR on hospitality 31
FIGURE 3.12. Twelve variables that experts view as most important for determining how resilient a country is to an AMR shock 31
FIGURE 3.13. Average resilience scores for labour, tourism and hospitality, by country, 2030 33
FIGURE 3.14. Correlation between average sector resilience and AMR death rate, by World Bank income group, 2030 34
FIGURE 3.15. Global increase in excess in-patient health care costs associated with AMR, by World Bank income group, 2020-2050 35
FIGURE 3.16. Population and labour force changes by 2050 relative to the business-as-usual scenario in a world without AMR, by World Bank income group 35
FIGURE 3.17. Health care cost savings of five AMR intervention scenarios in 2050 36
FIGURE 3.18. Macroeconomic impact (change in GDP) of five AMR intervention scenarios in 2050 37
FIGURE 3.19. Per cent and total GDP impact in 2050 due to improved treatment and innovation (in billion US$) 37
FIGURE 3.20. Estimated annual costs (in US$) and benefits in 2050 of better treatment for bacterial infections and innovative new gram-negative drugs 46
Annex Tables
TABLE A.1. Experts who completed the study survey and interview 55
*표시는 필수 입력사항입니다.
| *전화번호 | ※ '-' 없이 휴대폰번호를 입력하세요 |
|---|
| 기사명 | 저자명 | 페이지 | 원문 | 기사목차 |
|---|
| 번호 | 발행일자 | 권호명 | 제본정보 | 자료실 | 원문 | 신청 페이지 |
|---|
도서위치안내: / 서가번호:

우편복사 목록담기를 완료하였습니다.
*표시는 필수 입력사항입니다.
저장 되었습니다.
