
 대표어
대표어
 https://www.iza.org/publications/dp/17485/climate-change-and-the-decline-of-labor-share
권호기사보기
| 기사명 | 저자명 | 페이지 | 원문 | 기사목차 |
|---|
결과 내 검색
동의어 포함
Title page
Contents
Abstract 3
1. Introduction 4
2. Data 7
2.1. Climate Data 7
2.2. Labor Share 8
2.3. Covariates 9
3. Empirical Analysis 9
3.1. Baseline Results 9
3.2. Robustness Checks 12
4. Mechanism 13
4.1. Occupational Characteristics 13
4.2. Climate-Induced Automation 17
5. Assessment of Macroeconomic Impacts 20
6. Conclusion 21
References 23
Appendices for Online Publication 27
I. Additional Data Details 28
II. Additional Analyses 37
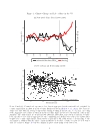
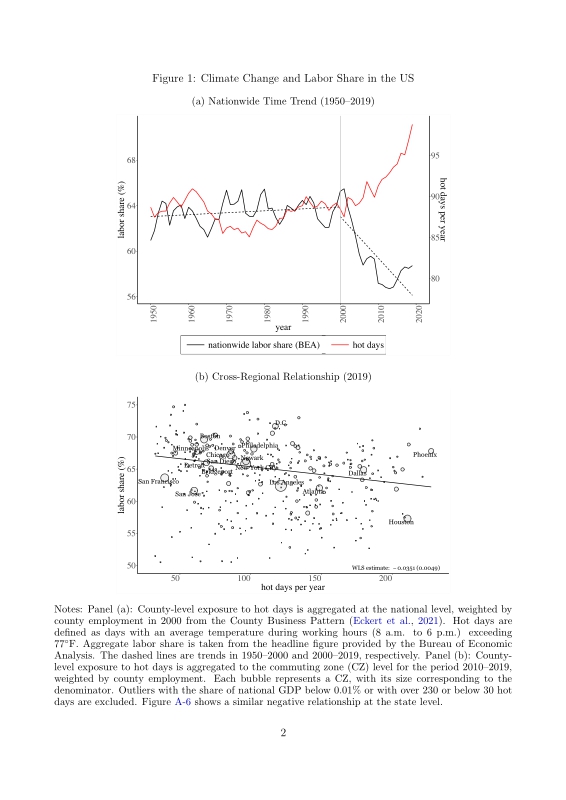
Figure 1. Climate Change and Labor Share in the US 5
Figure 2. Implied Impacts of Climate Change on Labor Share (1950-2001 vs. 2001-2019) 22
Figure A-1. Weather Stations in the US Mainland 28
Figure A-2. Hot and Cold Days across US Counties 29
Figure A-3. Exposure to Climate Change in the US 30
Figure A-4. Alternative Measures of the Labor Share 31
Figure A-5. Labor Shares across US Counties 32
Figure A-6. Hot Days and Labor Shares across US States (2019) 34
Figure A-7. Measurement: BEA Robots vs. IFR Robots 37
Figure A-8. Models with Sector heterogeneity and Adaptation 45
Figure A-9. Robustness Checks of Assessment across Modeling Choices 51
Figure A-10. Implied Impacts of Climate Change on Labor Shares 52
*표시는 필수 입력사항입니다.
| 전화번호 |
|---|
| 기사명 | 저자명 | 페이지 | 원문 | 기사목차 |
|---|
| 번호 | 발행일자 | 권호명 | 제본정보 | 자료실 | 원문 | 신청 페이지 |
|---|
도서위치안내: / 서가번호:

우편복사 목록담기를 완료하였습니다.
*표시는 필수 입력사항입니다.
저장 되었습니다.
