
 대표어
대표어
 https://www.accc.gov.au/about-us/publications/serial-publications/supermarkets-inquiry-2024-25-reports/supermarkets-inquiry-february-2025-final-report
권호기사보기
| 기사명 | 저자명 | 페이지 | 원문 | 기사목차 |
|---|
결과 내 검색
동의어 포함
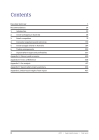
Title page 1
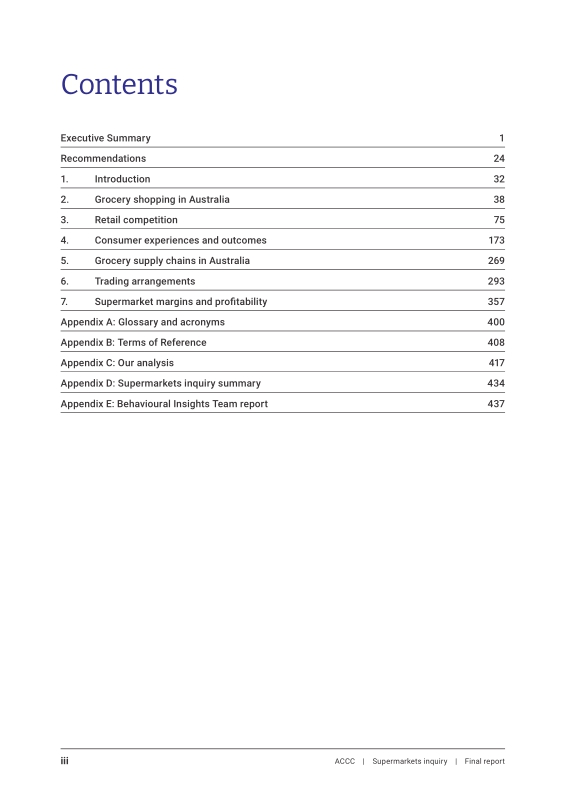
Contents 3
Executive Summary 4
Recommendations 27
1. Introduction 34
1.1. Scope of the inquiry 35
1.2. Our approach to conducting the inquiry 36
2. Grocery shopping in Australia 40
2.1. The cost of many inputs along grocery supply chains have risen substantially 42
2.2. Wages have not kept up with groceries inflation 47
2.3. The Australian supermarket industry is highly concentrated 51
2.4. Supermarkets use a range of practices to engage consumers 63
3. Retail competition 77
3.1. Competition in the supermarket industry matters 80
3.2. In particular, competition between full-service supermarkets is critical for consumers 81
3.3. Where competition is limited due to geographic factors, community-owned stores can benefit consumers 90
3.4. Prices are largely consistent at a state level within a supermarket chain's stores 92
3.5. Coles and Woolworths have limited incentive to compete vigorously on price 100
3.6. Price comparison assists competition 107
3.7. Non-price factors are key areas of competitive focus for supermarkets 117
3.8. Metcash has an important role to play in the competitiveness of independent supermarkets 127
3.9. We are unlikely to see significant entry or expansion by full-service supermarket chains in Australia 148
3.10. Securing suitable sites is challenging for all competitors, with Coles and Woolworths dominant 157
4. Consumer experiences and outcomes 175
4.1. Promotions are a key feature of supermarket pricing strategies 177
4.2. Promotions have a significant impact on consumer purchasing behaviour and sales 187
4.3. Promotional practices may make it difficult for consumers to assess prices and discounts 191
4.4. There is scope to improve unit pricing 203
4.5. Greater transparency is needed in relation to 'shrinkflation' 213
4.6. Supermarket loyalty programs are becoming increasingly important and sophisticated 218
4.7. Consumers on lower incomes are particularly vulnerable in the supermarket environment 248
4.8. Consumers in remote locations are paying higher prices for some groceries 254
5. Grocery supply chains in Australia 271
5.1. Grocery supply chain structures can vary significantly 273
5.2. The level of supermarket buyer power varies across grocery supply chains 287
5.3. Many suppliers say they fear retribution from raising concerns with supermarkets 290
5.4. Category managers have significant autonomy in how they deal with suppliers 291
6. Trading arrangements 295
6.1. Supermarkets classify different types of suppliers 297
6.2. Suppliers are required to comply with quality assurance and sourcing requirements 302
6.3. Some fresh produce trading terms are not transparent and increase risk for suppliers 307
6.4. Packaged grocery trading arrangements 334
6.5. Other trading terms 343
7. Supermarket margins and profitability 359
7.1. Profitability of Coles and Woolworths 361
7.2. ALDI's, Coles' and Woolworths' product margins have increased since 2019-20 375
Appendix A - Glossary and acronyms 402
Appendix B - Terms of Reference 410
Part 1. Preliminary 415
1. Name 415
2. Commencement 415
3. Authority 415
4. Definitions 415
Part 2. Price inquiry into groceries 417
5. Commission to hold an inquiry 417
6. Directions on matters to be taken into consideration in the inquiry 417
7. Directions as to holding of the inquiry 418
8. Period for completing the inquiry 418
Appendix C - Our analysis 419
Appendix D - Supermarkets inquiry summary 436
Appendix E - Behavioural Insights Team report 439
Tables 55
Table 2.1. The Australian supermarket industry is highly concentrated 55
Table 2.2. Coles and Woolworths account for a combined 57% share of take-home food and grocery sales 56
Table 3.1. Products that may not be priced on a national basis 94
Table 3.2. IGA stores skew more towards regional and remote than other supermarkets 133
Table 3.3. Number of undeveloped and unused sites intended for future supermarket use held by ALDI, Coles and Woolworths 165
Table 4.1/Table 4.29. Average spend per transaction in sampled stores 267
Table 5.1. Key responsibilities of category managers 292
Table 6.1. Woolworths' scorecard system is used to assign suppliers to either a bronze, silver, gold or platinum partnership tier 301
Table 6.2. Types of rebates and other payments that may be included in trading agreements 350
Table 7.1. Product categories and products for case studies 388
Table 7.2. Estimated percentage of promotional weeks where case study products sold at both Coles and Woolworths were on the same or different points in their price cycle 392
Table 7.3. Supplier payments to Coles and Woolworths for different types of activities 395
Table 7.4. Greater supplier funding results in greater margins for the supermarket compared with a scenario where there was no supplier funding 397
Figures 6
Figure 1.1. Wages have not kept up with grocery price inflation since late 2021 6
Figure 1.2. Prices increased at all supermarkets over the last 5 financial years, and significantly in 2022-23 7
Figure 1.3. ALDI's, Coles' and Woolworths' average product margins have increased since 2019-20, while Metcash banner stores' average product margin has been relatively flat 8
Figure 1.4. Over the last 5 financial years, Coles' average product margin has increased for its highest revenue products - branded packaged goods 9
Figure 1.5. Over the last 5 financial years, Woolworths' average product margin has increased for its highest revenue products - branded packaged goods 10
Figure 1.6. Supermarket EBIT margins suggest supermarkets were consistently profitable 11
Figure 1.7. Australian supermarkets appear profitable by comparison to their international peers 12
Figure 1.8. Store network overlap between Coles, Woolworths and competitors has increased since 2008 14
Figure 1.9. ALDI, Coles and Woolworths have grown their store networks since 2008 while IGA has contracted 17
Figure 1.10. IGA has increased its number of small stores, but decreased its number of medium and large stores 17
Figure 1.11. IGA stores skew more heavily towards regional and remote locations 18
Figure 1.12. Consumers in remote Australia often have no choice of supermarket 19
Figure 1.13. Examples of products that exhibited alternating high-low pricing cycles 22
Figure 2.1. Input prices for domestic food, beverage and tobacco manufacturing have risen significantly between 2021 and 2022, flowing through to higher output prices 44
Figure 2.2. Businesses' key operating costs have increased in the past 5 years 46
Figure 2.3. Primary producer input costs have increased post-COVID 47
Figure 2.4. Prices increased at all supermarkets over the last 5 financial years, and significantly in 2022-23 48
Figure 2.5. Grocery inflation in Australia was lower than many OECD countries 49
Figure 2.6. Wages have not kept up with grocery price inflation since late 2021 50
Figure 2.7. Australia's average annual real wage growth has been slower than many OECD countries 51
Figure 2.8. Supermarkets and non-supermarket grocery retailers 53
Figure 2.9. Coles and Woolworths account for a significant proportion of large format supermarkets nationally 57
Figure 2.10. ALDI, Coles and Woolworths have grown their store networks since 2008 while IGA has contracted 58
Figure 2.11. Store network overlap between Coles, Woolworths and competitors has increased since 2008 59
Figure 2.12. Many local markets are highly concentrated, in particular in regional and remote areas 61
Figure 2.13. Consumers in remote Australia often have no choice of supermarket 62
Figure 2.14. Overview of supermarket pricing and promotional strategies 64
Figure 2.15. Examples of everyday low pricing labels at Coles, IGA and Woolworths 65
Figure 2.16. Examples of specials labels at ALDI, Coles, IGA and Woolworths 67
Figure 2.17. Examples of markdown and clearance labels at Coles and Woolworths 68
Figure 2.18. Examples of longer-term discount promotion labels at Coles and Woolworths 69
Figure 2.19. Overview of promotions offered by ALDI, Coles, Metcash and Woolworths 72
Figure 3.1. Supermarkets and other non-supermarket grocery retailers, visualised by price and range 87
Figure 3.2. Differentiated offerings are apparent when we compare stores 88
Figure 3.3. Full-service supermarkets are each other's closest competitors 89
Figure 3.4. ACCC consumer survey respondents compared prices before shopping more in 2024 compared to 2008 108
Figure 3.5. The IGA network has contracted since 2008 128
Figure 3.6. IGA has increased its number of small stores, but decreased its number of medium and large stores 129
Figure 3.7. Metcash's share of industry revenue has contracted between 2008-09 and 2023-24 131
Figure 3.8. Metcash services a large, geographically dispersed retail network 144
Figure 3.9. Timeline of entry and expansion in Australia since 2008 150
Figure 3.10. Length of time ALDI, Coles and Woolworths have held undeveloped or unused freehold sites, which are intended for supermarket use 166
Figure 3.11. Length of time ALDI, Coles and Woolworths have held onto undeveloped or unused leasehold sites or sites subject to an agreement for lease,... 166
Figure 3.12. Map of Coles' vacant site in Maylands, WA 169
Figure 4.1. Percentage of products (SKUs) on promotion on average per promotional week in 2019 and 2023 at Coles and Woolworths 178
Figure 4.2. Percentage of sales revenue derived from promotions - Coles 179
Figure 4.3. Percentage of sales revenue derived from promotions - Woolworths 180
Figure 4.4. Percentage of sales revenue derived from promotions - Metcash banner stores 180
Figure 4.5. Percentage of sales revenue derived from promotions - ALDI 181
Figures 4.6. Examples of products that exhibited alternating high-low pricing cycles 184
Figures 4.7. Examples of products that did not exhibit alternating high-low pricing cycles 186
Figure 4.8. Percentage of units sold on promotion in 2023 188
Figure 4.9. Distribution of number of product (SKUs) by percentage uplift - Coles 189
Figure 4.10. Distribution of number of product (SKUs) by percentage uplift - Woolworths 190
Figure 4.11. Example of an in-store ‘specials' ticket provided by Woolworths 201
Figure 4.12. Example of in-store inconsistent use of unit pricing 208
Figure 4.13. Example of online inconsistent use of unit pricing across different supermarkets 210
Figure 4.14. Tesco's online unit pricing 211
Figure 4.15. Loyalty membership is growing 219
Figure 4.16. Average spend per transaction in 2023 for all customers compared to loyalty program members only (where loyalty card is scanned) 223
Figure 4.17. Percentage of total sales revenue and number of transactions attributable to Coles' and Woolworths' loyalty program members by calendar year 223
Figure 4.18. Loyalty program members provide increasing value over time 224
Figure 4.19. Consumers become more valuable as they become more engaged with loyalty programs 225
Figure 4.20. Surveyed consumers on lower incomes spend the highest proportion of their income on food and non-alcoholic beverages 249
Figure 4.21. Grocery spend by household income 250
Figure 4.22. Woolworths' percentage of multi-buy sales by year and SEIFA status 252
Figure 4.23. Coles' percentage of multi-buy sales by year and SEIFA status 252
Figure 4.24. Distribution of effective prices paid by consumers for sweet biscuits in non-remote and remote stores over the reporting period 259
Figure 4.25. Distribution of effective prices paid by consumers for fresh unflavoured cow's milk in non-remote and remote stores over the reporting period 260
Figure 4.26. Distribution of effective prices paid by consumers for apples in non-remote and remote stores over the reporting period 261
Figure 4.27. Distribution of effective prices paid by consumers for beef mince in metropolitan, regional and remote Metcash banner stores over the reporting period 262
Figure 4.28. Distribution of effective prices paid by consumers for eggs in non-remote and remote stores over the reporting period 263
Figure 5.1. Grocery supply chains can vary significantly 274
Figure 5.2. Fresh Produce Supply Chain 276
Figure 5.3. Packaged Groceries Supply Chain 280
Figure 6.1. Loose fresh produce is transported to the supermarket distribution centre in returnable plastic crates or single use cardboard boxes 328
Figure 6.2. Prepackaged fresh produce can be packaged in a variety of ways, depending on the produce type 329
Figure 6.3. An apple with a PLU sticker 332
Figure 6.4. Packaged produce is delivered to the supermarket distribution centre on a pallet 353
Figure 7.1. Profit and margin analysis sit at different accounting levels 362
Figure 7.2. Woolworths' EBIT and EBIT margin has been materially higher in the past 364
Figure 7.3. Supermarket EBIT margins suggest supermarkets have been consistently profitable 366
Figure 7.4. Coles' and Woolworths' NPAT margins have remained relatively stable over recent years 368
Figure 7.5. Coles' and Woolworths' gross margin increased from 2019-20 to 2023-24 369
Figure 7.6. Coles and Woolworths report higher EBIT margins than most of their international peers between 2018-19 and 2022-23 371
Figure 7.7. Coles Group and Woolworths Group NPAT margin is among the highest of their global peers between 2019-20 and 2022-23 372
Figure 7.8. Return on total capital for Coles Group and Woolworths Group is higher than most international peers identified by Woolworths in the 2022-23 financial year 373
Figure 7.9. Coles and Woolworths have achieved consistent revenue growth 375
Figure 7.10. ALDI's, Coles' and Woolworths' average product margins have increased since 2019-20 financial year, while Metcash banner stores' average product margin... 379
Figure 7.11. Growth in supermarkets' average product margins varies by Business Unit/Department 381
Figure 7.12. There are different types of private label products - supermarket-branded and pseudo brands 383
Figure 7.13. Proportion of branded and private label products on offer 384
Figure 7.14. Branded average product margins at ALDI, Coles and Woolworths increased since 2019-20 385
Figure 7.15. Over the last 5 financial years, Coles' average product margin increased for their highest sales revenue products - branded packaged goods 386
Figure 7.16. Similarly to Coles, over the last 5 financial years, Woolworths' average product margin increased for their highest sales revenue products - branded packaged goods 387
Figure 7.17. Average product margins for case study products varied considerably 390
Figure 7.18. Example of a dog food product where the price regularly alternated between Coles and Woolworths 392
Figure 7.19. Example of a milk product where the price predominantly remained at the standard price at both Coles and Woolworths 393
Figure 7.20. Example of a dishwashing tablet product where the price regularly alternated between Coles and Woolworths 394
Figure 7.21. Supplier funding increased between 2019-20 and 2023-24 and represents a significant amount of money to Coles and Woolworths 398
Boxes 69
Box 2.1. Longer-term discount promotions 69
Box 2.2. ACCC proceedings against Coles and Woolworths over alleged misleading discount pricing claims 71
Box 2.3. Loyalty programs and subscriptions offered by Coles and Woolworths 74
Box 3.1. Shopping missions 82
Box 3.2. Metro conversions may increase Woolworths' margins 99
Box 3.3. Coles and Woolworths monitor Amazon's pricing and may respond or consider responding on certain products (if not all overlapping products) 107
Box 3.4. Availability of historical pricing information 112
Box 3.5. Requiring retailers to publish prices online is unlikely to materially increase collusion risks 117
Box 3.6. IGAs use their independence to target their offerings to local areas 119
Box 3.7. Harris Farm has built its brand around fresh food quality and range 119
Box 3.8. Case study - Amazon's entry, slow expansion and recent share decline in the US grocery sector 123
Box 3.9. Case study - Drakes vertically integrates to procure its own supplies in South Australia 137
Box 3.10. Case study - Metcash may increase vertical integration in future 142
Box 3.11. Case study - Coles' competitive response to Kaufland's entry in Australia 149
Box 3.12. Case study - ALDI is unlikely to focus on growing its store numbers in Australia 151
Box 3.13. Case study - Amazon's likely competitive impact in supermarket competition in Australia remains unclear 152
Box 3.14. Case Study - Kaufland used Victoria's streamlined planning process 160
Box 3.15. Case study - Coles' vacant site in Maylands, WA 169
Box 4.1. There is mixed evidence regarding the impact of multi-buy promotions on consumer purchasing behaviour compared with other specials 191
Box 4.2. The role of heuristics in busy supermarket environments (online and offline) 194
Box 4.3. Recent changes to unit pricing in overseas jurisdictions 207
Box 4.4. Tesco's online unit pricing 211
Box 4.5. Coles' and Woolworths' use of loyalty data in other business units and subsidiaries 221
Box 4.6. Supermarket loyalty programs are increasingly using 'gamification' 226
Box 4.7. Bonus offers offered by Coles and Woolworths through their loyalty programs 229
Box 4.8. The prevalence and impact of member-only pricing in the UK and New Zealand 233
Box 7.1. Margin metrics at the product or category level 377
Box 7.2. Relationship between supermarkets' margins and payments received from suppliers 396
*표시는 필수 입력사항입니다.
| 전화번호 |
|---|
| 기사명 | 저자명 | 페이지 | 원문 | 기사목차 |
|---|
| 번호 | 발행일자 | 권호명 | 제본정보 | 자료실 | 원문 | 신청 페이지 |
|---|
도서위치안내: / 서가번호:

우편복사 목록담기를 완료하였습니다.
*표시는 필수 입력사항입니다.
저장 되었습니다.
