
 대표어
대표어
 https://www.gao.gov/products/gao-25-106286
권호기사보기
| 기사명 | 저자명 | 페이지 | 원문 | 기사목차 |
|---|
결과 내 검색
동의어 포함
Title page 1
Contents 4
Highlights 2
Letter 8
Background 12
Navy Long-Range Planning for Shipbuilding and Ship Repair 12
Shipbuilding and Ship Repair Industrial Base 14
Key Navy and DOD Organizations with Responsibilities Related to Shipbuilding and Repair 17
Ship Industrial Base Struggles to Meet Navy's Goals for Shipbuilding and Ship Repair 19
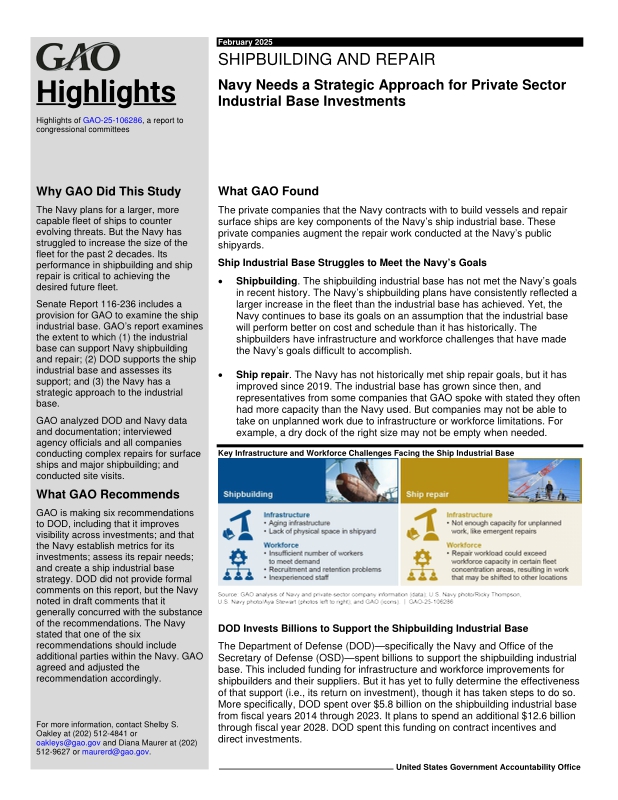
Shipbuilding Industrial Base Has Not Historically Met the Navy's Goals 19
Industrial Base Infrastructure and Workforce Limitations Make Shipbuilding Delays Difficult to Overcome 25
Ship Repair Industrial Base Has Not Met Schedule Goals Though It Has Seen Some Recent Improvements 29
Ship Repair Industrial Base Has Capacity but Cannot Always Surge to Accomplish Unplanned Work 30
DOD Has Yet to Fully Determine Effectiveness of or Ensure Visibility into Billions Spent on the Ship Industrial Base 38
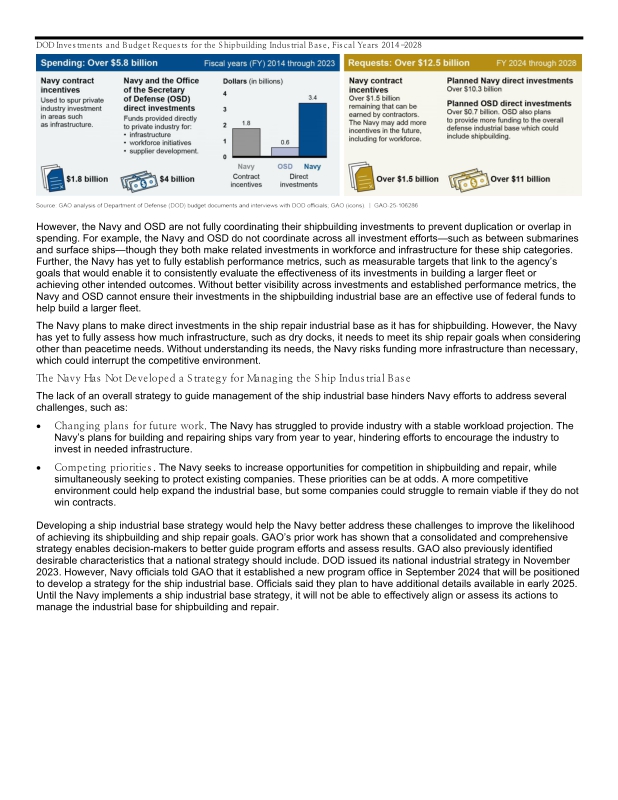
DOD Has Spent Billions to Bolster the Shipbuilding Industrial Base Over the Last Decade and Plans to Spend Billions More Through 2028 39
DOD Has Yet to Fully Assess the Effectiveness of Support for the Shipbuilding Industrial Base 44
Navy Plans to Provide Funding for Private Ship Repair Infrastructure Improvements Without Determining Needed Capacity 53
Navy's Approach to Industrial Base Management Is Not Guided by a Long-Term Strategy or Coordinated Leadership 55
Navy's Plans and Strategies to Provide Stable Projection of Workload Are Ineffective at Encouraging Industry Investment 55
Navy Faces Challenges in Balancing Competing Industrial Base Priorities 63
Navy Does Not Have a Strategy or Coordinated Leadership for Managing Ship Industrial Base Challenges 69
Conclusions 74
Recommendations for Executive Action 75
Agency Comments 76
Appendix I: Objectives, Scope, and Methodology 78
Appendix II: Misalignment Between Navy Shipbuilding Plan for Growth in the Fleet and the Navy's Battle Force Assessments 88
Appendix III: Examples of Shipbuilder Infrastructure Problems 91
Appendix IV: Purpose and Legal Authority for Department of Defense Investment Programs in Navy Shipbuilding 92
Appendix V: GAO Contacts and Staff Acknowledgments 93
Related GAO Products 94
Tables 4
Table 1. Number of Navy Planned Delivery of VCS and DDG 51 Compared with Actual Delivery Rates, Fiscal Years 2019-2023 20
Table 2. Navy Projection for Adding Surface Ship Dry Dock Capacity by Fleet Concentration Area, as of 2024 34
Table 3. Descriptions of Navy Direct Investment Categories for the Shipbuilding Industrial Base 42
Table 4. Descriptions of Office of the Secretary of Defense (OSD) Direct Investment Categories for the Shipbuilding Industrial Base 43
Table 5. Fleet Size by Ship Type Called for Based on Recent Navy Analysis by Fiscal Year 89
Table 6. Selected Direct Investment Legal Authorities for the Shipbuilding Industrial Base 92
Figures 5
Figure 1. Map of Major Shipbuilders for U.S. Navy Ships, as of September 2024 15
Figure 2. Map of Private Ship Repair Companies Conducting Complex Navy Ship Repair Work by Fleet Concentration, Area as of May 2024 17
Figure 3. Navy Ship Schedule Delays in Months for Ships Under Construction, as of September 2024 23
Figure 4. Navy Estimation of When Workload Could Exceed Capacity Based on Private Repair Companies' Workforce Levels, as of February 2024 36
Figure 5. Contract Incentives for Private Investment and Direct Investments for the Shipbuilding Industrial Base, Fiscal Years (FY) 2014-2028 40
Figure 6. Extent to Which the Navy and OSD Have Performed Selected Oversight Functions to Determine Effectiveness of Shipbuilding Industrial Base Funding 45
Figure 7. Greatest and Least Number of Ships Planned for Procurement in Navy Annual Shipbuilding Plans, Fiscal Years 2019-2025 57
Figure 8. Change in Fiscal Years 2020-2024 Navy Projections for Domestic Ship Repair Workload 59
Figure 9. Examples of Competing Priorities in the Navy Shipbuilding Industrial Base 64
Figure 10. Examples of Competing Priorities in the Navy Ship Repair Industrial Base 66
Figure 11. Organizational Structure for the Navy with Ship Repair Oversight Responsibility 72
Figure 12. Navy Planned Fleet Size Growth from Shipbuilding Plans, Fiscal Years 2016-2025 88
Figure 13. Examples of Key Infrastructure Limitations for Navy Shipbuilders 91
*표시는 필수 입력사항입니다.
| 전화번호 |
|---|
| 기사명 | 저자명 | 페이지 | 원문 | 기사목차 |
|---|
| 번호 | 발행일자 | 권호명 | 제본정보 | 자료실 | 원문 | 신청 페이지 |
|---|
도서위치안내: / 서가번호:

우편복사 목록담기를 완료하였습니다.
*표시는 필수 입력사항입니다.
저장 되었습니다.
