
 대표어
대표어
 https://www.accc.gov.au/about-us/publications/serial-publications/inquiry-into-the-national-electricity-market-2018-25-reports/inquiry-into-the-national-electricity-market-report-december-2024
권호기사보기
| 기사명 | 저자명 | 페이지 | 원문 | 기사목차 |
|---|
결과 내 검색
동의어 포함
Title page 1
Contents 10
Executive summary 3
1. Introduction 11
1.1. Our role in electricity markets 11
1.2. About this report 12
1.3. Structure of this report 13
2. Retail pricing 14
3. Competition, costs and margins in retail electricity markets 61
3.1. Retail market concentration decreased slightly in 2023-24 62
3.2. Retailer entry and exits are stabilising 64
3.3. The number of active retailers across the NEM continues to decline 65
3.4. Retailers' costs and profitability increased in most regions in 2023-24 66
Appendix A. Terms of reference 84
Appendix B. Methodology for data collection and analysis 85
Tables 20
Table 2.1. Prices were generally lower in 2024 than 2023 20
Table 2.2. Our maximum demand profile assumptions 37
Table 3.1. Cost stack increased across all NEM regions in 2023-24 71
Figures 21
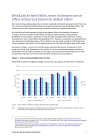
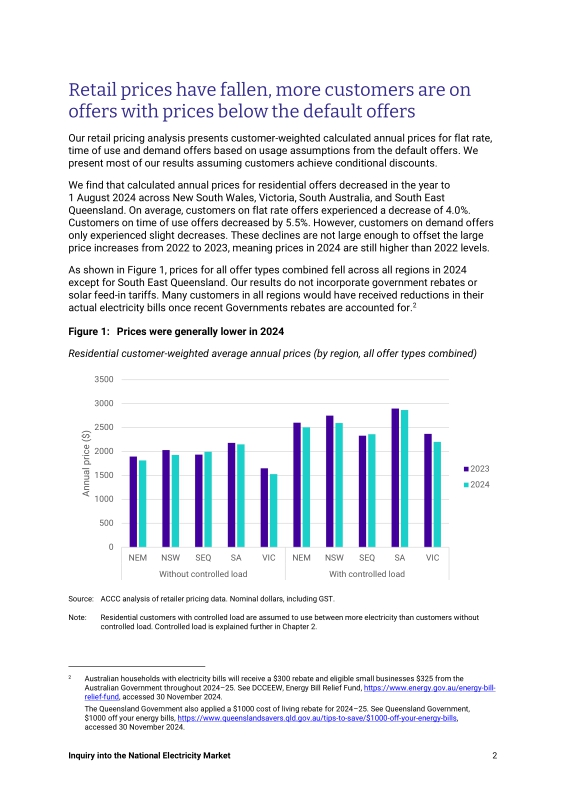
Figure 2.1. Prices were generally lower in 2024 21
Figure 2.2. Calculated annual prices are higher for offers with demand charges, but lower for time of use offers than flat rate offers 22
Figure 2.3. More customers are paying prices below the default offers 30
Figure 2.4. The majority of customers with demand charges are paying prices at or above the Default Market Offer, despite declines from 2023 32
Figure 2.5. Demand charges have a substantial impact on customer prices 33
Figure 2.6. Applying conditional discounts reduces the number of customers paying at or above the default offers 34
Figure 2.7. Higher priced offers are more likely to have conditional discounts 35
Figure 2.8. Conditional discounts can make up a significant proportion of a customer's bill 36
Figure 2.9. Increasing maximum demand has a modest impact on customer prices 39
Figure 2.10. Increasing maximum demand leads to more customers paying prices above the default offers 40
Figure 2.11. Differences between peak and off-peak usage charge rates are greater on weekdays than weekends 41
Figure 2.12. Our daily usage profile assumptions 43
Figure 2.13. Different changes in the time of daily electricity use have different impacts on calculated annual prices 44
Figure 2.14. The number of customers on offers with multiple complex pricing elements is increasing 45
Figure 2.15. Changes in usage patterns have a greater impact on customers whose offers have layers of complex pricing 47
Figure 2.16. Customers on older offers pay more 49
Figure 2.17. Calculated annual prices increase with the age of the offer 50
Figure 2.18. Customers on older offers increasingly pay more 51
Figure 2.19. Acquisition prices are further below the price cap of standing offers 52
Figure 2.20. The number of acquisition offers from non-big 3 retailers has rebounded 53
Figure 2.21. Customer switching rates have increased in response to market events and price changes 54
Figure 2.22. Retailer naming practices may mean consumers are confused by better offer messages 56
Figure 2.23. Customers are receiving potentially ineffective Better/Best Offer Messages 57
Figure 3.1. Market concentration declined slightly in 2023-24 in regions with competition 63
Figure 3.2. The ACT and Tasmania have become slightly less concentrated 63
Figure 3.3. Most customers are served by only a few retailers in each NEM region 64
Figure 3.4. The number of retailers entering the market increased in 2024 65
Figure 3.5. The number of active retailers in smaller regions increased slightly, in 2023-24 but fell across the NEM 66
Figure 3.6. Retailer cost stacks for residential and small business increased in 2023-24 68
Figure 3.7. Retailer wholesale costs for residential customers increased significantly in 2023-24 69
Figure 3.8. Retailer wholesale costs for small business customers increased significantly in 2023-24 70
Figure 3.9. Retailer wholesale costs increased in all regions in 2023-24 72
Figure 3.10. Spot prices increased in the latter half of 2023-2024 but have since fallen 73
Figure 3.11. Contract prices have been trending up since April 2024 73
Figure 3.12. There were small increases in network costs in 2023-24 75
Figure 3.13. National Electricity Market-wide retail margins in 2023-24 increased materially to their highest level since 2017-18 for residential customers 76
Figure 3.14. National Electricity Market-wide retail margins in 2023-24 increased materially to their highest level since 2018-19 for small business customers 76
Figure 3.15. Retail margins for residential customers significantly increased in South Australia, South East Queensland and New South Wales in 2023-24 77
Figure 3.16. Retail margins for small business customers increased in all NEM regions except Victoria in 2023-24 78
Figure 3.17. The big 3 retailers had high margin growth while margins across other retailers were stable 79
Figure 3.18. Averaging margin across multiple years indicates profitability has trended downward over the longer term but may be increasing again 79
Figure 3.19. Retail costs for serving residential and small business customers increased for the first time since 2016-17 in the National Electricity Market 80
Figure 3.20. Rising costs to serve residential customers as the cost advantage gap narrows between big 3 and non-big 3 retailers 81
Figure 3.21. Rising acquisition and retention costs as non-big 3 retailers invest into advertising and marketing to increase market share in 2023-24 82
Boxes 17
Box 2.1. Understanding common pricing elements 17
Box 2.2. PEMM prohibitions commenced on 10 June 2020 26
Box 2.3. Differences between the Default Market Offer and Victorian Default Offer 28
Box 2.4. How are demand offer charges calculated? 38
Box 2.5. How are time of use offer charges calculated? 42
Box 2.6. How do 'Best Offer' and 'Better Offer' messages support customers? 55
Box 2.7. Policy processes underway considering retail pricing and consumer protections 59
Box 3.1. Why are the cost stack results different to those reported in retailers' annual reports? 67
Box 3.2. What is transfer pricing? 74
Box 3.3. What components are included in our retail costs? 80
Appendix Tables 86
Table B.1. Default Market Offer and Victorian Default Offer usage assumptions 86
Table B.2. Default Market Offer and Victorian Default Offer usage assumptions 87
Table B.3. Default Market Offer and Victorian Default Offer usage assumptions 88
Appendix Figures 90
Figure B.1. Solar feed-in tariffs only increase slightly with price 90
*표시는 필수 입력사항입니다.
| 전화번호 |
|---|
| 기사명 | 저자명 | 페이지 | 원문 | 기사목차 |
|---|
| 번호 | 발행일자 | 권호명 | 제본정보 | 자료실 | 원문 | 신청 페이지 |
|---|
도서위치안내: / 서가번호:

우편복사 목록담기를 완료하였습니다.
*표시는 필수 입력사항입니다.
저장 되었습니다.
