
 대표어
대표어
 https://www.accc.gov.au/about-us/publications/serial-publications/container-stevedoring-monitoring-reports/container-stevedoring-monitoring-report-2023-24
권호기사보기
| 기사명 | 저자명 | 페이지 | 원문 | 기사목차 |
|---|
결과 내 검색
동의어 포함
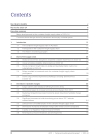
Title page 1
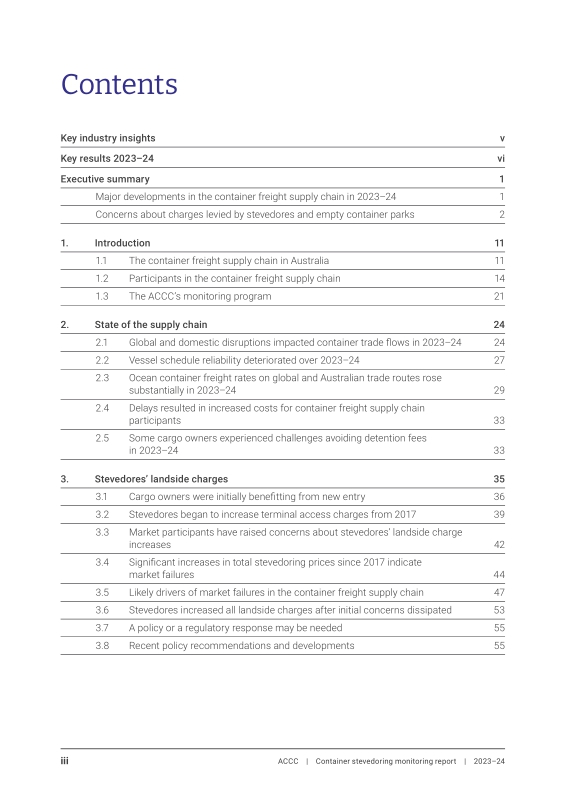
Contents 3
Key industry insights 5
Key results 2023-24 6
Executive summary 7
Major developments in the container freight supply chain in 2023-24 7
Concerns about charges levied by stevedores and empty container parks 8
1. Introduction 17
1.1. The container freight supply chain in Austra 17
1.2. Participants in the container freight supply chain 20
1.3. The ACCC's monitoring program 27
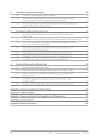
2. State of the supply chain 30
2.1. Global and domestic disruptions impacted container trade flows in 2023-24 30
2.2. Vessel schedule reliability deteriorated over 2023-24 33
2.3. Ocean container freight rates on global and Australian trade routes rose substantially in 2023-24 35
2.4. Delays resulted in increased costs for container freight supply chain participants 39
2.5. Some cargo owners experienced challenges avoiding detention fees in 2023-24 39
3. Stevedores' landside charges 41
3.1. Cargo owners were initially benefitting from new entry 42
3.2. Stevedores began to increase terminal access charges from 2017 45
3.3. Market participants have raised concerns about stevedores' landside charge increases 48
3.4. Significant increases in total stevedoring prices since 2017 indicate market failures 50
3.5. Likely drivers of market failures in the container freight supply chain 53
3.6. Stevedores increased all landside charges after initial concerns dissipated 59
3.7. A policy or a regulatory response may be needed 61
3.8. Recent policy recommendations and developments 61
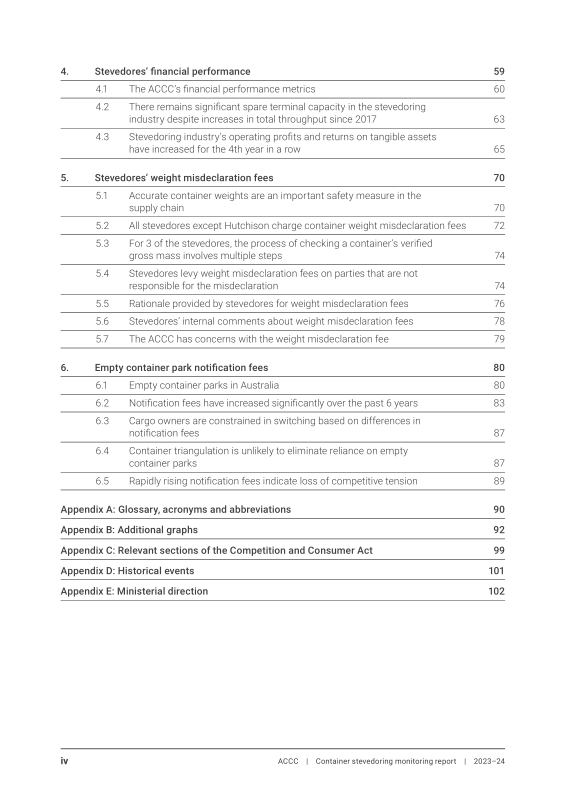
4. Stevedores' financial performance 65
4.1. The ACCC's financial performance metrics 66
4.2. There remains significant spare terminal capacity in the stevedoring industry despite increases in total throughput since 2017 69
4.3. Stevedoring industry's operating profits and returns on tangible assets have increased for the 4th year in a row 71
5. Stevedores' weight misdeclaration fees 76
5.1. Accurate container weights are an important safety measure in the supply chain 76
5.2. All stevedores except Hutchison charge container weight misdeclaration fees 78
5.3. For 3 of the stevedores, the process of checking a container's verified gross mass involves multiple steps 80
5.4. Stevedores levy weight misdeclaration fees on parties that are not responsible for the misdeclaration 80
5.5. Rationale provided by stevedores for weight misdeclaration fees 82
5.6. Stevedores' internal comments about weight misdeclaration fees 84
5.7. The ACCC has concerns with the weight misdeclaration fee 85
6. Empty container park notification fees 86
6.1. Empty container parks in Australia 86
6.2. Notification fees have increased significantly over the past 6 years 89
6.3. Cargo owners are constrained in switching based on differences in notification fees 93
6.4. Container triangulation is unlikely to eliminate reliance on empty container parks 93
6.5. Rapidly rising notification fees indicate loss of competitive tension 95
Appendix A: Glossary, acronyms and abbreviations 96
Appendix B: Additional graphs 98
Appendix C: Relevant sections of the Competition and Consumer Act 105
Appendix D: Historical events 107
Appendix E: Ministerial direction 108
Tables 67
Table 4.1. Financial performance metrics and definitions 67
Table 4.2. Estimates of effective terminal capacity utilisation: by port, 2018-2023 70
Table 4.3. Average operating profit margins of the stevedoring industry and the 3 incumbents across multiple timeframes 73
Table 4.4. Average rate of return on average tangible assets of the industry and the 3 incumbents across multiple timeframes 75
Table 6.1. Empty container parks at each container port in Australia 88
Table 6.2. Highest notification fees levied in a given year, by port: 2018-2024 91
Table 6.3. Notification fees in Sydney, in nominal dollars, selected operators, 2018 to 2024 92
Figures 18
Figure 1.1. Total annual throughput of Australia's 5 largest container ports: 2001-02 to 2023-24 18
Figure 1.2. Total annual full container imports and exports (TEU) at Australia's 5 largest container ports, 2015-16 to 2023-24 19
Figure 1.3. Supply chain participants - imports and exports 20
Figure 1.4. Container stevedores in Australia's monitored port locations 24
Figure 1.5. Contractual relationships and flow of charges between parties in the supply chain 26
Figure 2.1. The longer route around the Cape of Good Hope 31
Figure 2.2. Global vessel schedule reliability June 2018 to September 2024 34
Figure 2.3. Platts Container Index ($US/40-foot equivalent unit), 30 September 2017 to 30 September 2024 36
Figure 2.4. Platts Container Rates ($US/40-foot equivalent unit) - Australian import routes, September 2023 to October 2024 37
Figure 3.1. Aggregate annual investment, stevedoring industry & 3 incumbents: 2006-07 to 2023-24 43
Figure 3.2. Stylised investment-price cycle in a capital-intensive industry 44
Figure 3.3. Key capital expenditure items (as published in the notice) 47
Figure 3.4. Further detail on Patrick Terminals' investment program and cost increases (as published in the notice) 48
Figure 3.5. Real total revenue per lift and real total costs per lift, stevedoring industry: 2001-02 to 2023-24 52
Figure 3.6. Terminal access charges levied by stevedores (in nominal terms) at the Port of Melbourne: January 2017 to January 2025 60
Figure 4.1. Total throughput, stevedoring industry & 3 incumbents: 2001-02 to 2023-24 69
Figure 4.2. EBIT, EBITA and EBITDA operating profits of the 3 incumbents: 1998-99 to 2023-24 71
Figure 4.3. EBIT, EBITA and EBITDA operating profit margins of the 3 incumbents: 1998-99 to 2023-24 72
Figure 4.4. Returns on average tangible assets of the 3 incumbents: 2007-08 to 2023-24 74
Figure 5.1. Implementation of weight misdeclaration fees 78
Figure 5.2. Weight misdeclaration fees, effective January 2025 ($/container) 79
Figure 5.3. Weight misdeclaration fees for import containers 81
Figure 5.4. Weight misdeclaration fees for export containers 82
Figure 5.5. Extract from a stevedore's board paper 85
Figure 6.1. Highest notification fees per container (in nominal terms), by port: 2018-2024 90
Figure 6.2. Container exchange - triangulation 94
Boxes 38
Box 2.1. Shipping line surcharges and general rate increases in 2023-24 38
Box 3.1. Hutchison's initial approach to win market share with a lower infrastructure levy 46
Box 3.2. Summary of DP World's 60-day notice to industry, 31 October 2023 47
Box 3.3. Summary of Patrick Terminals' 60-day notice to industry, 4 January 2024 48
Box 3.4. Productivity Commission's Finding 6.3 61
Box 3.5. Productivity Commission's Draft Recommendation 6.2 62
Box 3.6. Productivity Commission's Recommendation 6.2 63
Appendix Tables 107
Table D.1. Selection of historical events throughout the monitoring regime affecting stevedoring throughput, revenue and costs 107
Appendix Figures 98
Figure B.1. EBIT, EBITA and EBITDA operating profits of the stevedoring industry: 1998-99 to 2023-24 98
Figure B.2. EBIT, EBITA and EBITDA operating profit margins of the stevedoring industry: 1998-99 to 2023-24 98
Figure B.3. Returns on average tangible assets of the stevedoring industry: 2007-08 to 2023-24 99
Figure B.4. Tangible asset base, stevedoring industry & 3 incumbents: 2006-07 to 2023-24 99
Figure B.5. Stevedores' EBITDA operating profit margins in Melbourne, Sydney and Brisbane: 1998-99 to 2023-24 100
Figure B.6. Total industry revenues in real terms: 2001-02 to 2023-24 100
Figure B.7. Industry total revenues per lift in real terms: 2001-02 to 2023-24 101
Figure B.8. Industry total costs per lift in real terms: 2001-02 to 2023-24 101
Figure B.9. Industry total revenues per lift for full containers in real terms: 2017-18 to 2023-24 102
Figure B.10. Industry total revenues per lift for empty containers in real terms: 2017-18 to 2023-24 102
Figure B.11. Terminal access charges levied by stevedores in nominal dollars at each monitored port location: January 2017 to July 2024 103
Figure B.12. Average land rent per square metre in real terms, by port: 2017-18 to 2023-24 104
Figure B.13. Average property costs per lift in real terms, by port: 2001-02 to 2023-24 104
*표시는 필수 입력사항입니다.
| 전화번호 |
|---|
| 기사명 | 저자명 | 페이지 | 원문 | 기사목차 |
|---|
| 번호 | 발행일자 | 권호명 | 제본정보 | 자료실 | 원문 | 신청 페이지 |
|---|
도서위치안내: / 서가번호:

우편복사 목록담기를 완료하였습니다.
*표시는 필수 입력사항입니다.
저장 되었습니다.
