 https://www.weforum.org/publications/the-future-of-jobs-report-2025/
권호기사보기
| 기사명 | 저자명 | 페이지 | 원문 | 기사목차 |
|---|
| 대표형(전거형, Authority) | 생물정보 | 이형(異形, Variant) | 소속 | 직위 | 직업 | 활동분야 | 주기 | 서지 | |
|---|---|---|---|---|---|---|---|---|---|
| 연구/단체명을 입력해주세요. | |||||||||
|
|
|
|
|
|
* 주제를 선택하시면 검색 상세로 이동합니다.
Title page 1
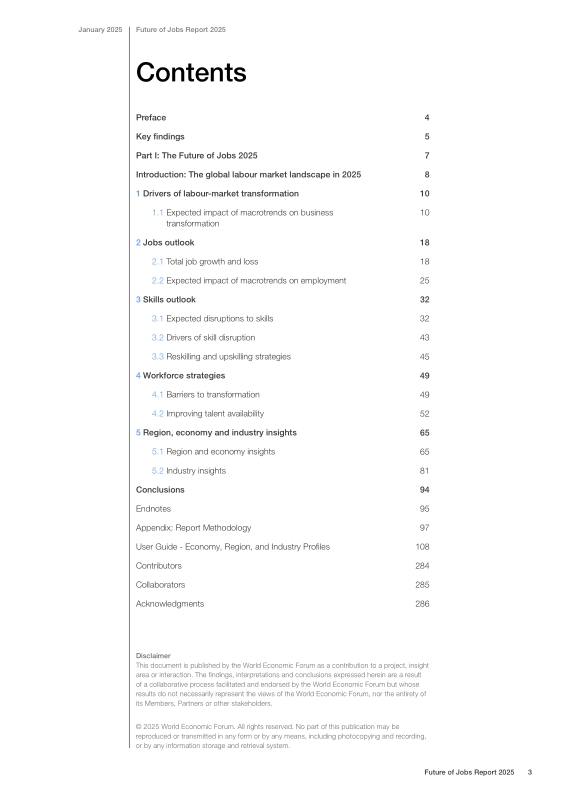
Contents 3
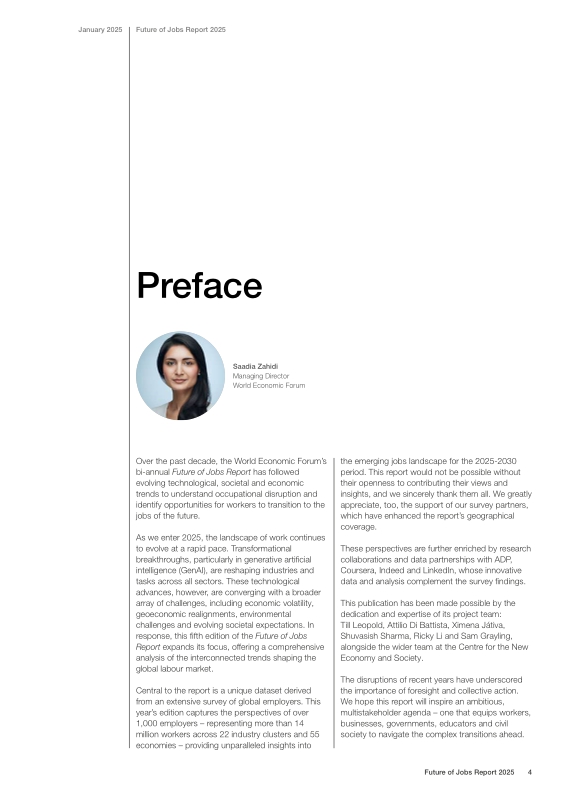
Preface 4
Key findings 5
Introduction: The global labour market landscape in 2025 8
1. Drivers of labour-market transformation 10
1.1. Expected impact of macrotrends on business transformation 10
2. Jobs outlook 18
2.1. Total job growth and loss 18
2.2. Expected impact of macrotrends on employment 25
3. Skills outlook 32
3.1. Expected disruptions to skills 32
3.2. Drivers of skill disruption 43
3.3. Reskilling and upskilling strategies 45
4. Workforce strategies 49
4.1. Barriers to transformation 49
4.2. Improving talent availability 52
5. Region, economy and industry insights 65
5.1. Region and economy insights 65
5.2. Industry insights 81
Conclusions 94
Endnotes 95
Appendix: Report Methodology 97
User Guide: Economy, Region, and Industry Profiles 108
Contributors 284
Collaborators 285
Acknowledgments 286
Tables 29
TABLE 2.1. Impact of geoeconomic trends ends on off-shoring and re-shoring 29
TABLE 4.1. Planned implementation of diversity, equity and inclusion measures, 2025-2030, by region 57
TABLE 5.1. Impact of macrotrends, 2025-2030, by region 77
TABLE 5.2. Impact of technology related trends, 2025-2030, by region 78
TABLE 5.3. Skill importance in 2025, by region 79
TABLE 5.4. Skill evolution, 2025-2030, by region 80
TABLE 5.5. Impact of macrotrends, 2025-2030 90
TABLE 5.6. Impact of technology related trends, 2025-2030 91
TABLE 5.7. Skill importance in 2025 92
TABLE 5.8. Skill evolution, 2025-2030 93
Figures 10
FIGURE 1.1. Macrotrends driving business transformation 10
FIGURE 1.2. Technology trends driving business transformation, 2025-2030 11
FIGURE 1.3. Geoeconomic trends, by economy 14
FIGURE 1.4. Geoeconomic trends, by industry cluster 15
FIGURE 1.5. Dual impact of declining and growing labour forces, by economy and income group, 2025-2030 17
FIGURE 2.1. Global employment change by 2030 18
FIGURE 2.2. Fastest-growing and fastest-declining jobs, 2025-2030 19
FIGURE 2.3. Job growth and decline, 2025-2030 21
FIGURE 2.4. Largest growing and declining jobs, 2025-2030 23
FIGURE 2.5. Job growth and decline (number of employees), 2025-2030 24
FIGURE 2.6. Expected impact of macrotrends ends and technology trends on jobs, 2025-2030 25
FIGURE 2.7. The shifting human-machine frontier: automation versus augmentation, 2025-2030 26
FIGURE 2.8. Expected shift in the human share of work task delivery in total firm output driven by automation versus augmentation, 20252030,global average 27
FIGURE 2.9. Expected shift in the human share of work task delivery in total firm output driven by automation versus augmentation, 20252030,by industry 28
FIGURE 3.1. Disruptions to skills 33
FIGURE 3.2. Disruption to skills 2025-2030, by economy 34
FIGURE 3.3. Core skills in 2025 35
FIGURE 3.4. Skills on the rise, 2025-2030 37
FIGURE 3.5. Top 10 industries for increasing skill requirements, 2025-2030 39
FIGURE 3.6. Core skills in 2030 41
FIGURE 3.7. Skill importance gap and skill proficiency gap between growing and declining jobs 42
FIGURE 3.8. Training completion as part of learning and development strategies, 2023 vs. 2025, by industry 46
FIGURE 3.9. Upskilling and reskilling outlook, 2025-2030 47
FIGURE 3.10. Funding for training, 2025-2030 48
FIGURE 3.11. Expected outcomes from investing in training, 2025-2030 48
FIGURE 4.1. Barriers to organizational transformation, 2025-2030 49
FIGURE 4.2. Talent outlook, 2025-2030 50
FIGURE 4.3. alent hiring availability, by economy, 2025-2030 51
FIGURE 4.4. Workforce strategies, 2025-2030 52
FIGURE 4.5. Business practices to increase talent availability, 2025-2030 53
FIGURE 4.6. Public policies to increase talent availability, 2025-2030 55
FIGURE 4.7. Planned implementation of diversity, equity and inclusion measures, 2025-2030 56
FIGURE 4.8. Planned implementation of diversity, equity and inclusion measures, 2023 vs. 2025 56
FIGURE 4.9. Diversity, equity, and inclusion priority groups, 2025-2030 58
FIGURE 4.10. Wage outlook, 2025-2030 58
FIGURE 4.11. Wage strategies, 2025-2030 59
FIGURE 4.12. Skill assessment mechanisms, 2025-2030 62
FIGURE 4.13. Barriers to AI adoption 63
FIGURE 4.14. Workforce strategy in response to AI, 2025-2030 63
FIGURE 5.1. Attracting talent to the firm and to the industry 82
FIGURE 5.2. Workforce strategy: automation or augmentation, by industry 83
Boxes 12
BOX 1.1. Demand for generative AI skills 12
BOX 2.1. Green hiring rates 30
BOX 3.1. Generative AI and human-centred skills 43
BOX 4.1. Talent availability: an employee perspective 53
BOX 4.2. Wage premium for skills and experience 59
Box Figures 12
FIGURE B1.1. Demand for generative AI skills 12
FIGURE B2.1. Green hiring rates 30
FIGURE B3.1. Current capacity for substitution by Generative AI, by skill group 44
FIGURE B4.1. Business practices to boost talent availability: employee vs. employer perspective 54
FIGURE B4.2A. Cumulative wage premium by skill level 60
FIGURE B4.2B. Marginal wage premium by skill level 60
FIGURE B4.3. Marginal wage premium: female vs. male workers 61
FIGURE B4.4. Growth in relative concentration of AI technologies, by industry, 2016-2024 64
Appendix Tables 98
TABLE A1. Taxonomy of industry categories 98
TABLE A2. Skill taxonomy 101
TABLE A3. Job taxonomy 102
*표시는 필수 입력사항입니다.
| 전화번호 |
|---|
| 기사명 | 저자명 | 페이지 | 원문 | 기사목차 |
|---|
| 번호 | 발행일자 | 권호명 | 제본정보 | 자료실 | 원문 | 신청 페이지 |
|---|
도서위치안내: / 서가번호:

우편복사 목록담기를 완료하였습니다.
*표시는 필수 입력사항입니다.
저장 되었습니다.
