
 대표어
대표어
 https://documents.worldbank.org/en/publication/documents-reports/documentdetail/099061824141539356/P1797021fe98d1044198df1d50f3446aaa4

권호기사보기
| 기사명 | 저자명 | 페이지 | 원문 | 기사목차 |
|---|
결과 내 검색
동의어 포함
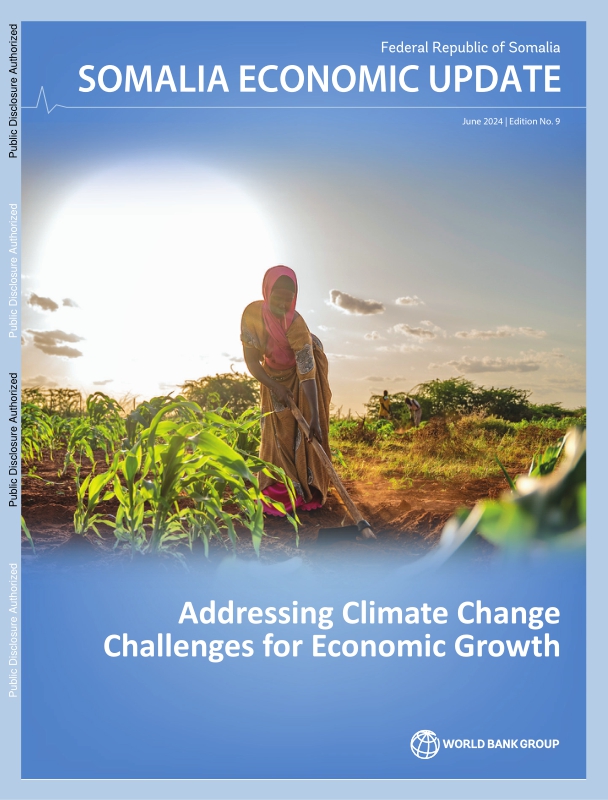
Title page 1
Contents 6
ABBREVIATIONS 8
ACKNOWLEDGEMENTS 9
FOREWORD 10
HORDHAC 11
EXECUTIVE SUMMARY 12
FULINTA KOOBAN 16
RECENT ECONOMIC DEVELOPMENTS 20
1. Somalia Macroeconomic Summary 21
1.1. The Global and Regional Economy 21
2. Recent Economic Developments in Somalia 22
3. Medium-Term Outlook and Risks 33
4. Conclusion and Summary Policy Options 38
SPECIAL FOCUS: SOMALIA CLIMATE CHANGE AND ADAPTATION POLICY ACTIONS 40
5. The Context of Climate Change in Somalia 41
6. Climate Trends and Impacts 43
6.1. Climate Overview 43
6.2. Climate Disasters 44
6.3. Chronic Climate Change Stresses on Agricultural Productivity 45
6.4. Heat Stress and Human Health 47
7. Social and Economic Impacts 49
7.1. Damage and Physical Capital 50
7.2. Impacts on Labor and Human Capital 51
7.3. Agricultural Production 52
7.4. Large-scale Displacement 53
7.5. Poverty and Vulnerability 54
7.6. Climate, Fragility and Conflict 57
8. Integrating Climate Considerations into Somalia's Development 58
8.1. Resilience to and Preparedness for Extreme Climate Events 60
8.2. Build Resilience into Somalia's Development 61
8.3. Accessing Finance for Climate Adaptation Related Activities 63
REFERENCES 64
Tables 7
Table 2.1. Government fiscal operations, 2022-2024 28
Table 2.2. Fiscal operations at sub-national governments 30
Table 2.3. Somalia: Decomposition of total public debt over the HIPC initiative 32
Table 3.1. Selected economic and poverty indicators (% of GDP unless otherwise indicated) 33
Table 7.1. Summary of Somalia's climate risks with magnitude and trend measures 50
Table 7.2. Projected impacts of coastal flooding with 25-year return period, excluding damage to crops and livestock 51
Table 7.3. Heat impacts on labor productivity, by sector (percentage change) 52
Figures 7
Figure 2.1. Somalia annual contribution to total GDP growth (growth rate percentage points) 22
Figure 2.2. Agriculture production rebounded in 2023, from the 2020-23 severe drought 23
Figure 2.3. Inflationary pressures eased, driven by decline in food prices 25
Figure 2.4. Overall banks' performance signals increasing confidence in Somalia's financial sector 26
Figure 2.5. Trade activities rebounded in 2023 26
Figure 2.6. Remittances have remained relatively resilient to recurrent shocks 27
Figure 2.7. FGS revenue mobilization efforts are paying off, even though the base remains low 27
Figure 2.8. Increasing FGS wage bill, while sector spending is skewed toward security and administration 29
Figure 2.9. Revenue performance remains strong, but still too low to cover increasing expenditure needs 31
Figure 5.0. Country climate vulnerability index versus readiness index score 42
Figure 6.1. Projected mean annual temperature 43
Figure 6.2. Projected mean annual precipitation 43
Figure 6.3. Trends in Somalia's largest daily maximum temperature and precipitation 44
Figure 6.4. Projections of the annual number of days (with max. temperature above 35℃) for different greenhouse gas (GHG) emissions scenarios 44
Figure 6.5. Projected annual SPEI Drought Index 45
Figure 7.1. Weather-related disasters in Somalia, 2008-23 53
Figure 7.2. Share of households affected by drought by residency and consumption quintile, 2022 54
Figure 7.3. Poverty headcount by region and share of population exposed to climate shocks, 2022 54
Figure 7.4. Violence, food insecurity, and internal displacement across Somalia 56
Boxes 7
Box 2.1. Recurrent climatic shocks are intensifying Somalia's already fragile environment 24
Box 3.1. Somalia's external debt profile 35
*표시는 필수 입력사항입니다.
| 전화번호 |
|---|
| 기사명 | 저자명 | 페이지 | 원문 | 기사목차 |
|---|
| 번호 | 발행일자 | 권호명 | 제본정보 | 자료실 | 원문 | 신청 페이지 |
|---|
도서위치안내: / 서가번호:

우편복사 목록담기를 완료하였습니다.
*표시는 필수 입력사항입니다.
저장 되었습니다.
