
 대표어
대표어
 https://library.wmo.int/records/item/68835-state-of-the-global-climate-2023?offset=6

권호기사보기
| 기사명 | 저자명 | 페이지 | 원문 | 기사목차 |
|---|
결과 내 검색
동의어 포함
Title page 1
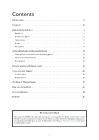
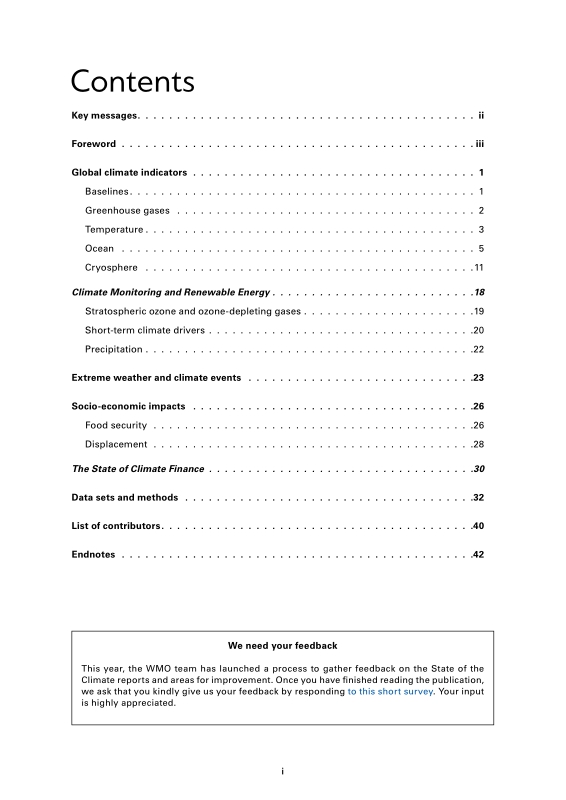
Contents 3
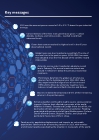
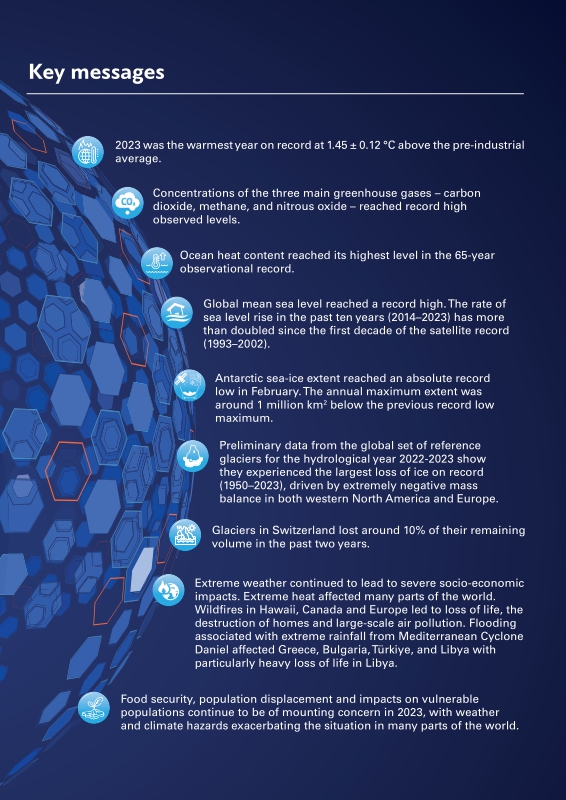
Key messages 4
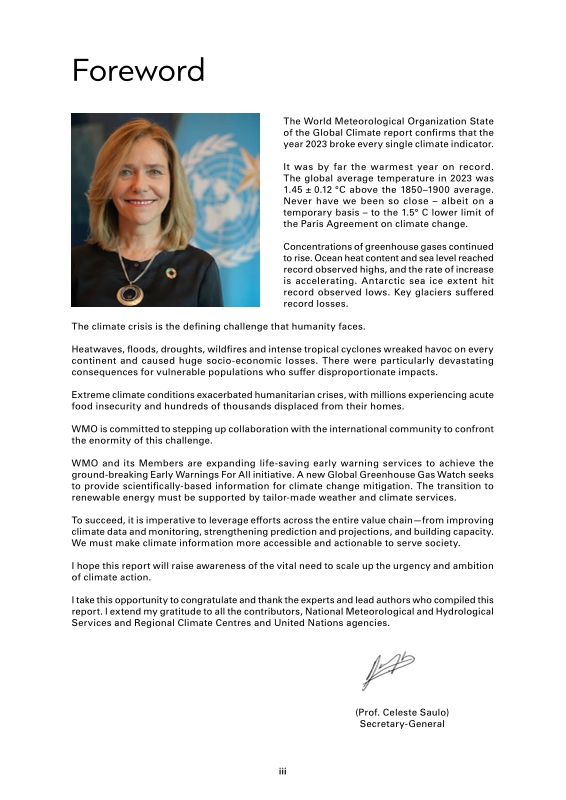
Foreword 5
Global climate indicators 6
BASELINES 6
GREENHOUSE GASES 7
TEMPERATURE 8
OCEAN 10
CRYOSPHERE 16
Climate Monitoring and Renewable Energy 23
STRATOSPHERIC OZONE AND OZONE-DEPLETING GASES 24
SHORT-TERM CLIMATE DRIVERS 25
PRECIPITATION 27
Extreme weather and climate events 28
Socio-economic impacts 31
FOOD SECURITY 31
DISPLACEMENT 33
The State of Climate Finance 35
Data sets and methods 37
List of contributors 45
Endnotes 47
Figures 7
Figure 1. Top row: Monthly globally averaged mole fraction (measure of atmospheric concentration), from 1984 to 2022, of (a) CO₂ in parts per million,... 7
Figure 2. Annual global mean temperature anomalies (relative to 1850-1900) from 1850 to 2023. Data are from six data sets as indicated in the legend,... 8
Figure 3. Mean near-surface temperature anomalies (difference from the 1991-2020 average) for 2023. Data are the median of six data sets as indicated... 9
Figure 4. Global ocean heat content (OHC) anomalies relative to the 2005-2021 average for the 0-2000m depth layer 1960-2023. Ensemble mean time series... 10
Figure 5. Observed upper 2000m OHC trend from 1958 to 2023 11
Figure 6. GMSL evolution between January 1993 and December 2023 based on satellite altimetry. The black line is the best estimate, and the grey shaded area... 11
Figure 7. 3-month averages of altimetry-based sea level anomalies (relative to the 1993-2012 average, which is the product climatology) for January to March 2023... 12
Figure 8. (a) Global map showing the highest MHW category (for definitions, see Data set and methods) experienced at each pixel over 2023... 13
Figure 9. As for Figure 8 but showing marine cold-spells rather than marine heatwaves. Data are from NOAA OISST 14
Figure 10. Global annual mean ocean surface pH (purple) covering the period 1985-2022. The shaded area indicates the estimated uncertainty in the values 15
Figure 11. Map illustrating surface ocean carbonate chemistry measurement locations received for SDG indicator 14.3.1 ocean acidification reporting by IOC/UNESCO.... 15
Figure 12. (left) Daily Arctic sea-ice extent from January through December, showing 2023 (red line) against the climate normal (1991-2020, dark blue)... 16
Figure 13. (left) Daily Antarctic sea-ice extent from January through December, showing 2023 (red) conditions against the 1991-2020 climate normal (dark blue)... 17
Figure 14. Greenland Ice Sheet melt conditions through 2023: (left) Cumulative melt days for Greenland in 2023. White areas indicate no melting occurred.... 18
Figure 15. GRACE gravitational mass balance data for the Greenland and Antarctic ice sheets, April 2002 through September 2023 19
Figure 16. Annual mass balance of reference glaciers with more than 30 years of ongoing glaciological measurements. Annual mass change values are given... 20
Figure 17. (left) Total annual loss of Swiss glaciers related to the current ice volume. The vertical bars indicate the percentage change in ice volume relative... 20
Figure 18. (a) Place Glacier in the southern Coast Mountains, British Columbia, Canada, 16 August, 2023, indicating the dearth of seasonal snow and... 21
Figure 19. May snow-cover extent for the Northern Hemisphere (dark blue) and North America (light blue), 1967-2023. The 1991-2020 average for each region... 22
Figure 20. Monthly percentage anomalies of four energy indicators for wind power (WP), solar PV (SPV), hydropower (WTP) and energy demand (EDD)... 23
Figure 21. Area (millions of km²) and Minimum Ozone where the total ozone column is less than 220 Dobson units; 2023 is shown in red. The three most recent... 24
Figure 22. Time series of NOAA's Oceanic Niño index from January 1950 to December 2023 showing the presence of cooler-then-average conditions (blue)... 25
Figure 23. Total precipitation in 2023, expressed as a quantile of the 1991-2020 reference period, for areas that would have been in the driest 20% (brown)... 27
Figure 24. Annual Area Burned in Canada 1986-2023 (millions of hectares) 29
Figure 25. Global prevalence of undernourishment (as a%) and number of undernourished (in millions) since 2005 31
Figure 26. Global tracked climate finance and average estimated annual needs through 2050 36
*표시는 필수 입력사항입니다.
| 전화번호 |
|---|
| 기사명 | 저자명 | 페이지 | 원문 | 기사목차 |
|---|
| 번호 | 발행일자 | 권호명 | 제본정보 | 자료실 | 원문 | 신청 페이지 |
|---|
도서위치안내: / 서가번호:

우편복사 목록담기를 완료하였습니다.
*표시는 필수 입력사항입니다.
저장 되었습니다.
