
 대표어
대표어
 https://www.accc.gov.au/about-us/publications/serial-publications/insurance-monitoring-reports/accc-insurance-monitoring-report-2025
권호기사보기
| 기사명 | 저자명 | 페이지 | 원문 | 기사목차 |
|---|
결과 내 검색
동의어 포함
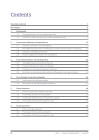
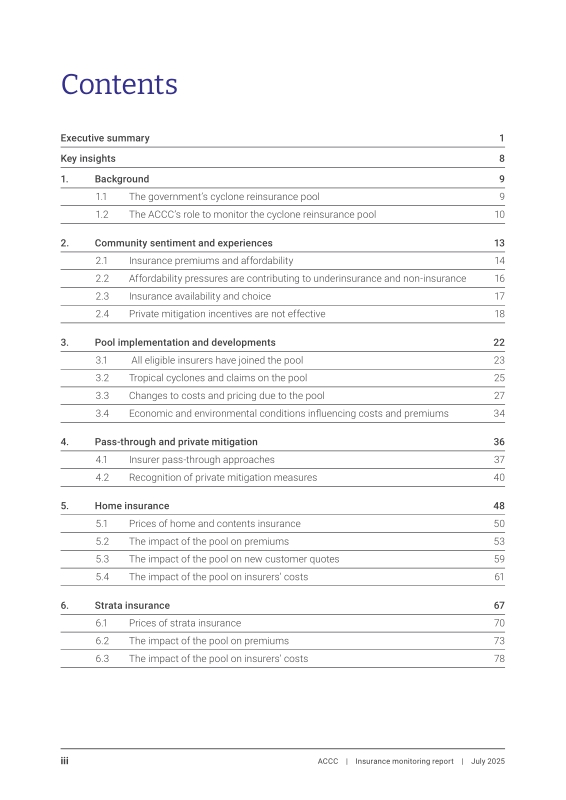
Title page 1
Contents 3
Executive summary 5
Key insights 12
1. Background 13
1.1. The government's cyclone reinsurance pool 13
1.2. The ACCC's role to monitor the cyclone reinsurance pool 14
1.2.1. Direction to monitor prices, costs and profits 14
1.2.2. How we monitor the impacts of the pool 15
2. Community sentiment and experiences 17
2.1. Insurance premiums and affordability 18
2.1.1. Home insurance premiums still a concern 18
2.1.2. Relief on strata premiums for some 19
2.1.3. Insurance premiums a top concern for SMEs 19
2.1.4. Affordability a complex problem for regional communities and the most vulnerable 19
2.1.5. Lack of premium transparency causing frustration 20
2.2. Affordability pressures are contributing to underinsurance and non-insurance 20
2.3. Insurance availability and choice 21
2.4. Private mitigation incentives are not effective 22
2.4.1. Impact of private mitigation on premiums is inconsistent and small 23
2.4.2. Upfront cost a barrier to private mitigation, even with resilience grants 23
2.4.3. Uncertainty about mitigation measures and their impact on premiums a significant barrier 23
3. Pool implementation and developments 26
3.1. All eligible insurers have joined the pool 27
3.2. Tropical cyclones and claims on the pool 29
3.2.1. The pool's claims coverage period 30
3.3. Changes to costs and pricing due to the pool 31
3.3.1. Changes to reinsurance arrangements due to the pool 32
3.3.2. Non-pool related changes to reinsurance arrangements 33
3.3.3. Changes to pricing calculations due to the pool 34
3.3.4. Insurers' modelling of the pool's impact on premiums 37
3.4. Economic and environmental conditions influencing costs and premiums 38
3.4.1. Building material and labour costs 38
3.4.2. Extreme weather events 38
4. Pass-through and private mitigation 40
4.1. Insurer pass-through approaches 41
4.1.1. Approaches to pass-through vary across insurers 42
4.1.2. Other pricing practices adopted by insurers may affect pass-through 43
4.2. Recognition of private mitigation measures 44
4.2.1. Insurers vary in their approach and commitment to implementing mitigation frameworks 47
4.2.2. The amount of mitigation discounts may differ across insurers 49
4.2.3. Communication with policyholders about private mitigation is limited 50
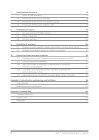
5. Home insurance 52
5.1. Prices of home and contents insurance 54
5.1.1. Premiums paid for home and contents insurance 54
5.1.2. Premiums by sum insured 56
5.2. The impact of the pool on premiums 57
5.2.1. Results by wind risk band 58
5.2.2. Results by region, town and city 60
5.2.3. Results by insurer 63
5.3. The impact of the pool on new customer quotes 63
5.4. The impact of the pool on insurers' costs 65
5.4.1. Breakdown of retail premiums 65
5.4.2. Insurer costs incurred 67
6. Strata insurance 71
6.1. Prices of strata insurance 74
6.1.1. Premiums paid for strata insurance 74
6.1.2. Premiums by sum insured 76
6.2. The impact of the pool on premiums 77
6.2.1. Results by wind risk band 77
6.2.2. Results by region, town and city 79
6.3. The impact of the pool on insurers' costs 82
6.3.1. Breakdown of retail premiums 82
6.3.2. Insurer costs incurred 82
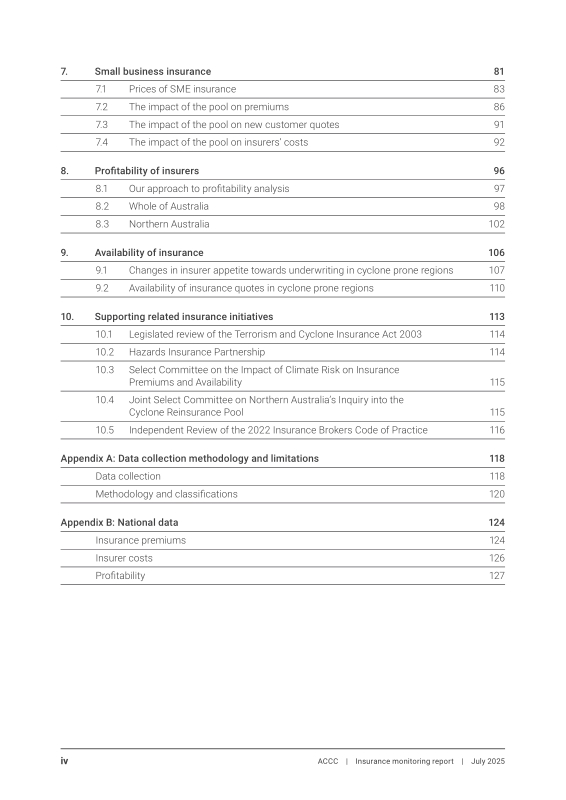
7. Small business insurance 85
7.1. Prices of SME insurance 87
7.1.1. Premiums paid for SME insurance 87
7.1.2. Premiums by sum insured 89
7.2. The impact of the pool on premiums 90
7.2.1. Results by wind risk band 90
7.2.2. Results by region, town and city 92
7.3. The impact of the pool on new customer quotes 95
7.4. The impact of the pool on insurers' costs 96
7.4.1. Breakdown of retail premiums 96
7.4.2. Insurer costs incurred 97
8. Profitability of insurers 100
8.1. Our approach to profitability analysis 101
8.1.1. Sources of information and metrics used for our analysis 101
8.2. Whole of Australia 102
8.2.1. Insurers have made 2 years of profits after 2 years of losses 102
8.2.2. Gross earned premium has increased, but profit has not followed the same trend 103
8.2.3. Profit margins vary across insurers and are volatile year to year 104
8.3. Northern Australia 106
8.3.1. Insurer profits in northern Australia remain volatile, but have improved 106
8.3.2. Strata and SME insurance are more challenging markets for insurers in northern Australia 108
9. Availability of insurance 110
9.1. Changes in insurer appetite towards underwriting in cyclone prone regions 111
9.1.1. Changes to underwriting guidelines 112
9.1.2. Changes to embargoes 112
9.1.3. Changes to exposure limits 113
9.2. Availability of insurance quotes in cyclone prone regions 114
9.2.1. Home insurance 114
9.2.2. SME insurance 115
10. Supporting related insurance initiatives 117
10.1. Legislated review of the Terrorism and Cyclone Insurance Act 2003 118
10.2. Hazards Insurance Partnership 118
10.3. Select Committee on the Impact of Climate Risk on Insurance Premiums and Availability 119
10.4. Joint Select Committee on Northern Australia's Inquiry into the Cyclone Reinsurance Pool 119
10.5. Independent Review of the 2022 Insurance Brokers Code of Practice 120
Appendix A: Data collection methodology and limitations 122
Data collection 122
Methodology and classifications 124
Appendix B: National data 128
Insurance premiums 128
Insurer costs 130
Profitability 131
Tables 46
Table 4.1. ARPC's reinsurance premium discount per mitigation measure for home and strata properties 46
Table 5.1. Average premiums and their percentage change from 2022-23 for combined home and contents insurance, by region, 2022-23 to 2023-24 55
Table 5.2. Average premiums and percentage change for combined home and contents insurance, by cyclone risk, pre and post pool 59
Table 6.1. Average premiums and their percentage change from 2022-23 for strata insurance, by region, 2022-23 to 2023-24 75
Table 6.2. Average premiums per $100,000 sum insured for strata insurance, by cyclone risk, pre and post pool 78
Table 7.1. Average premiums and their percentage change from 2022-23 for small business insurance, by region, 2022-23 to 2023-24 89
Table 7.2. Average premiums per $100,000 sum insured for small business insurance, by cyclone risk, pre and post pool 91
Table 8.1. Gross loss ratio (GLR) and net loss ratio (NLR) for all home and contents insurance, by region, 2010-11 to 2023-24 108
Figures 28
Figure 3.1. Timeline of pool development and events 28
Figure 3.2. Timeline example of lag in pricing changes following the commencement of the pool 37
Figure 5.1. Average premiums for combined home and contents insurance, by Statistical Area Level 3, 2024 55
Figure 5.2. Average premiums for combined home and contents insurance, by region, 2007-08 to 2023-24 56
Figure 5.3. Average premiums per $100,000 sum insured for combined home and contents insurance, by region, 2007-08 to 2023-24 57
Figure 5.4. Distribution of retail premiums per $100,000 sum insured for combined home and contents insurance, by cyclone risk, pre and post pool 58
Figure 5.5. Change in average premiums per $100,000 sum insured for combined home and contents insurance, by wind risk band, pre and post pool 60
Figure 5.6. Change in average premiums per $100,000 sum insured for combined home and contents insurance, by Statistical Area Level 3, pre and post pool 61
Figure 5.7. Distribution of retail premiums per $100,000 sum insured for combined home and contents insurance, by city or town, pre and post pool 62
Figure 5.8. Distribution of retail premiums per $100,000 sum insured for combined home and contents insurance, by capital city, pre and post pool 62
Figure 5.9. Distribution of retail premiums per $100,000 sum insured for combined home and contents insurance, by insurer, medium to high cyclone risk, pre and post pool 63
Figure 5.10. Distribution of quoted premiums per $100,000 sum insured for home insurance, medium to high cyclone risk areas, April 2022 to January 2025 64
Figure 5.11. Index of average quoted premiums per $100,000 sum insured for home insurance, by wind risk band groups, April 2022 to January 2025 65
Figure 5.12. Breakdown of average retail premium for combined home and contents insurance, medium to high cyclone risk areas, pre and post pool 66
Figure 5.13. Breakdown of average retail premium for combined home and contents insurance, nil to low cyclone risk areas, pre and post pool 66
Figure 5.14. Average cost incurred per policy by cost categories, all home and contents insurance, by region, 2021-22 to 2023-24, adjusted for inflation 67
Figure 5.15. Reinsurance costs and recoveries for all home and contents insurance, northern Australia, 2010-11 to 2023-24, adjusted for inflation 69
Figure 5.16. Reinsurance costs and recoveries for all home and contents insurance, rest of Australia, 2010-11 to 2023-24, adjusted for inflation 69
Figure 6.1. Average premiums for strata insurance, by Statistical Area Level 3, 2024 74
Figure 6.2. Average premiums for strata insurance, by region, 2007-08 to 2023-24 76
Figure 6.3. Average premiums per $100,000 sum insured for strata insurance, by region, 2007-08 to 2023-24 77
Figure 6.4. Distribution of retail premiums per $100,000 sum insured for strata insurance, by cyclone risk, pre and post pool 78
Figure 6.5. Change in average retail premiums for strata insurance, by wind risk band, pre and post pool 79
Figure 6.6. Change in average premiums per $100,000 sum insured for strata insurance, by Statistical Area Level 3, pre and post pool 80
Figure 6.7. Distribution of retail premiums per $100,000 sum insured for strata insurance, by city or town, pre and post pool 81
Figure 6.8. Distribution of retail premiums per $100,000 sum insured for strata insurance, by capital city, pre and post pool 81
Figure 6.9. Average cost incurred per policy by cost categories for strata insurance, by region, 2021-22 to 2023-24, adjusted for inflation 83
Figure 6.10. Reinsurance costs and recoveries for strata insurance, northern Australia, 2010-11 to 2023-24, adjusted for inflation 84
Figure 7.1. Average premiums for SME combined building and contents insurance, by Statistical Area Level 3, 2024 88
Figure 7.2. Average premiums for SME combined building and contents insurance per $100,000 sum insured, 2021-22 to 2023-24 90
Figure 7.3. Distribution of retail premiums per $100,000 sum insured for SME combined building and contents insurance, by cyclone risk, pre and post pool 91
Figure 7.4. Change in average premium per $100,000 sum insured for SME combined building and contents insurance, by wind risk band, pre and post pool 92
Figure 7.5. Change in average premiums per $100,000 sum insured for SME combined building and contents insurance, by Statistical Area Level 3, pre and post pool 93
Figure 7.6. Distribution of retail premiums per $100,000 sum insured for SME combined building and contents insurance, by city or town, pre and post pool 94
Figure 7.7. Distribution of retail premiums per $100,000 sum insured for SME combined building and contents insurance, by capital city, pre and post pool 94
Figure 7.8. Distribution of quoted premium per $100,000 sum insured for SME contents insurance, medium to high cyclone risk areas, July 2023 to January 2025 95
Figure 7.9. Index of average quoted premiums per $100,000 sum insured for SME contents insurance, by wind risk band group, July 2023 to January 2025 96
Figure 7.10. Average cost incurred per policy by cost categories, all SME building and contents insurance, by region, 2021-22 to 2023-24, adjusted for inflation 97
Figure 7.11. Reinsurance costs and recoveries for all SME insurance, northern Australia, 2019-20 to 2023-24, adjusted for inflation 99
Figure 8.1. Net profit or loss before tax for all home and contents, strata and SME insurance, Australia, 2019-20 to 2023-24, adjusted for inflation 103
Figure 8.2. Gross earned premium versus profit/loss before tax for all home and contents insurance, Australia, 2010-11 to 2023-24 104
Figure 8.3. Profit margin for all home and contents, strata and SME insurance, by insurer, Australia, 2019-20 to 2023-24 105
Figure 8.4. Gross loss ratio and net loss ratio for all home and contents insurance, Australia, 2010-11 to 2023-24 106
Figure 8.5. Combined operating ratio for all home and contents insurance, by region, 2010-11 to 2023-24 107
Figure 8.6. Combined operating ratio for all home and contents, strata and SME insurance in northern Australia, 2010-11 to 2023-24 109
Figure 9.1. Quote success rate by wind risk bands, home insurance, April 2023 to January 2025 115
Figure 9.2. Quote success rate by wind risk bands, SME contents insurance, July 2023 to January 2025 116
Boxes 25
Box 2.1. Regional Development Australia insurance surveys 25
Box 3.1. Reinsurance concepts 32
Box 3.2. Generalised process for calculating a retail premium 35
Box 4.1. Pass-through approach categories and examples 42
Box 6.1. How strata insurance is arranged in Australia 73
Box 7.1. Small business insurance has different characteristics to home insurance 87
Box 8.1. Measures of insurers' profitability 102
Appendix Tables 128
Table B.1. Average premiums for home insurance by year 128
Table B.2. Average premiums for strata insurance by year 129
Table B.3. Average premiums for SME insurance by year 129
Table B.4. Average cost per policy by year 130
Table B.5. Profitability ratios by year - all home, contents, strata and small business insurance 131
Table B.6. Profitability ratios by year - all home and contents insurance 131
Appendix Figures 125
Figure A.1. Data included in the definitions of 'post pool policies' and 'pre pool policies' 125
*표시는 필수 입력사항입니다.
| 전화번호 |
|---|
| 기사명 | 저자명 | 페이지 | 원문 | 기사목차 |
|---|
| 번호 | 발행일자 | 권호명 | 제본정보 | 자료실 | 원문 | 신청 페이지 |
|---|
도서위치안내: / 서가번호:

우편복사 목록담기를 완료하였습니다.
*표시는 필수 입력사항입니다.
저장 되었습니다.
