
 대표어
대표어
 https://www.accc.gov.au/about-us/publications/serial-publications/inquiry-into-the-national-electricity-market-2018-25-reports/inquiry-into-the-national-electricity-market-report-july-2025
권호기사보기
| 기사명 | 저자명 | 페이지 | 원문 | 기사목차 |
|---|
결과 내 검색
동의어 포함
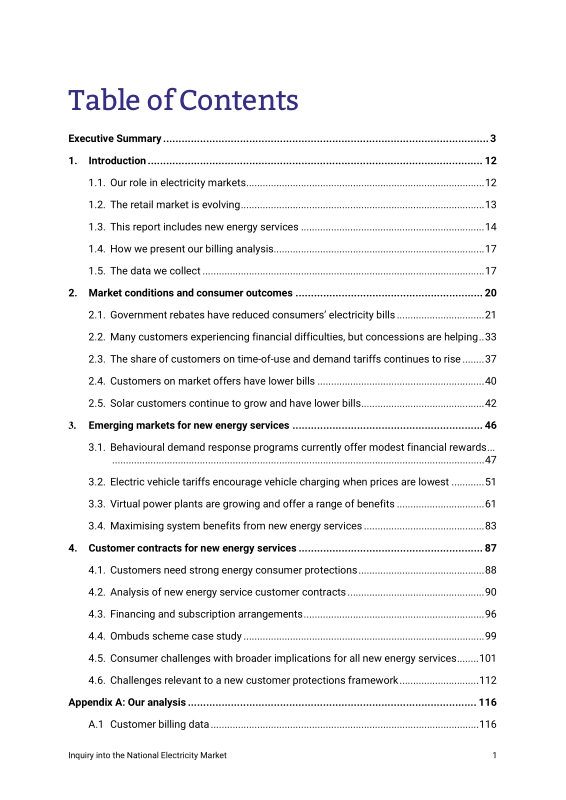
Title page 1
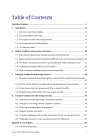
Contents 3
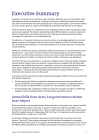
Executive Summary 5
1. Introduction 14
1.1. Our role in electricity markets 14
1.2. The retail market is evolving 15
1.2.1. The role of retailers and customers is changing 15
1.2.2. The role of consumer energy resources in the energy transition 16
1.3. This report includes new energy services 16
1.3.1. We focus on 3 main types of new energy services 17
1.3.2. Consumers take up new energy services for financial and non-financial reasons 17
1.4. How we present our billing analysis 19
1.5. The data we collect 19
1.5.1. Regular billing data 19
1.5.2. New energy services data 20
2. Market conditions and consumer outcomes 22
2.1. Government rebates have reduced consumers' electricity bills 23
2.1.1. Broad-based government rebates have significantly reduced bills, which would have otherwise increased 24
2.1.2. Residential customer bills fell in each region 27
2.1.3. Changes in small business bills varied across regions 28
2.1.4. Electricity usage varied across customer types and regions 29
2.1.5. Effective prices for residential customers decreased across each NEM region in 2024 32
2.1.6. Effective prices for small businesses varied across regions in 2024 34
2.2. Many customers experiencing financial difficulties, but concessions are helping 35
2.3. The share of customers on time-of-use and demand tariffs continues to rise 39
2.3.1. Regulatory changes and new energy resources are guiding customers towards time-of-use and demand tariffs 40
2.3.2. Customers on time-of-use and demand tariffs use more electricity and have higher bills to those on flat rates 41
2.4. Customers on market offers have lower bills 42
2.5. Solar customers continue to grow and have lower bills 44
2.5.1. More customers are choosing solar for environmental concerns and desire for energy independence 44
3. Emerging markets for new energy services 48
3.1. Behavioural demand response programs currently offer modest financial rewards 49
3.1.1. Customers can sign up to behavioural demand response programs but not everyone will be invited to participate 50
3.1.2. The big 3 retailers serve most residential behavioural demand response customers 51
3.1.3. Behavioural demand response programs have high participation rates but offer limited bill benefits 52
3.2. Electric vehicle tariffs encourage vehicle charging when prices are lowest 53
3.2.1. Electric vehicle tariffs are being taken up rapidly 55
3.2.2. Big 3 retailers have largest share of electric vehicle tariff customers 57
3.2.3. Bills for electric vehicle tariff customers are higher but not for those customers who also have solar 58
3.2.4. Higher bills for electric vehicle customers are driven by higher usage 59
3.3. Virtual power plants are growing and offer a range of benefits 63
3.3.1. The supply of virtual power plant services is competitive 64
3.3.2. Virtual power plant participants experience lower electricity bills 69
3.3.3. Virtual power plants and batteries enable customers to reduce and shift their electricity usage from the grid 75
3.3.4. Consumer investments in energy resources and benefits of self-consumption and coordination 77
3.4. Maximising system benefits from new energy services 85
3.4.1. Linking battery subsidies to their capacity to deliver system benefits 86
3.4.2. Competition is central to maximise consumer benefits from reforms 87
4. Customer contracts for new energy services 89
4.1. Customers need strong energy consumer protections 90
4.2. Analysis of new energy service customer contracts 92
4.2.1. Behavioural demand response programs 94
4.2.2. Electric vehicle tariffs 96
4.2.3. Virtual power plants 96
4.3. Financing and subscription arrangements 98
4.3.1. Customers are financing their solar systems more than ever 98
4.3.2. There are various types of financing arrangements 99
4.3.3. Alternatives to upfront purchase of solar and battery systems - potential risks 100
4.4. Ombuds scheme case study 101
4.5. Consumer challenges with broader implications for all new energy services 103
4.5.1. Challenge 1 - Increasing product complexity 103
4.5.2. Challenge 2 - multiple supply chain participants make identifying and resolving responsibility difficult 105
4.5.3. Challenge 3 - Relinquishing some control 107
4.5.4. Challenge 4 - Lack of clarity about who benefits from use of the virtual power plant investment 109
4.5.5. Challenge 5 - Maintaining certainty and confidence in investment when terms can change 111
4.5.6. Challenge 6 - Limiting the potential for early contract termination to exacerbate, or push people into, financial hardship 112
4.5.7. Challenge 7 - Ensuring adequate consumer safeguards around subsidy schemes 112
4.6. Challenges relevant to a new customer protections framework 114
4.6.1. Observations relating to the reform of energy-specific consumer protections 115
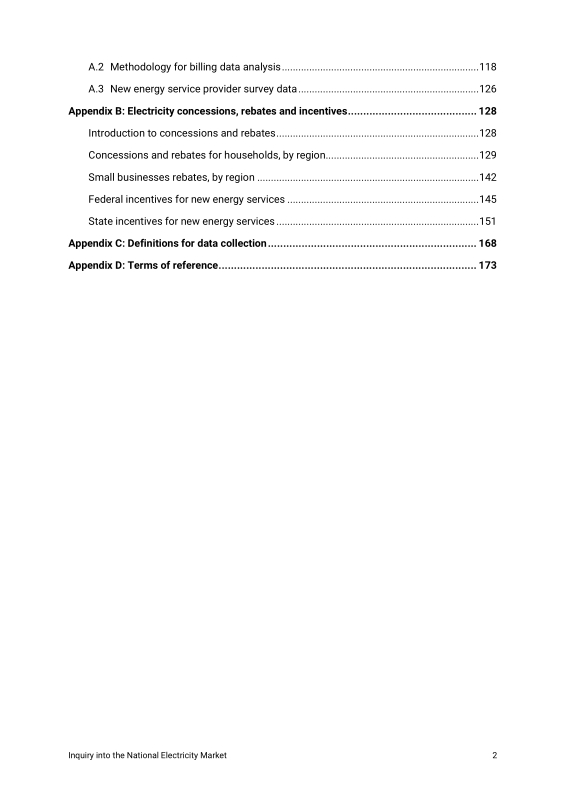
Appendix A: Our analysis 118
A.1. Customer billing data 118
A.2. Methodology for billing data analysis 120
A.3. New energy service provider survey data 128
Appendix B: Electricity concessions, rebates and incentives 130
Introduction to concessions and rebates 130
Concessions and rebates for households, by region 131
Small businesses rebates, by region 144
Federal incentives for new energy services 147
State incentives for new energy services 153
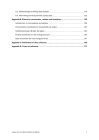
Appendix C: Definitions for data collection 170
Appendix D: Terms of reference 175
Tables 16
Table 1.1. Examples of consumer energy resources and new energy services 16
Table 1.2. Common sentiments around new energy services 18
Table 2.1. Rebates significantly reduced residential bills in quarter 3 2024 24
Table 2.2. Broad based (non-targeted) rebates paid to all households 25
Table 2.3. Many customers are experiencing financial difficulties 37
Table 2.4. Remaining premium feed-in tariff schemes and expiry dates 45
Table 4.1. Overview of contractual terms and potential risks for each type of new energy service 94
Table 4.2. Overview of contractual terms and potential risks for virtual power plant offers 97
Figures 26
Figure 2.1. Rebates significantly reduced residential customer bills, particularly in South East Queensland 26
Figure 2.2. Rebates reduced small business bills in all regions 27
Figure 2.3. Annualised bills rose slightly in New South Wales, Victoria and South Australia but fell sharply in South East Queensland 28
Figure 2.4. Annualised bills for small businesses have been relatively stable in most regions 29
Figure 2.5. Electricity usage increased for residential customers in 2024 but declined for small businesses 30
Figure 2.6. Yearly electricity usage is trending down for residents in New South Wales and South Australia 31
Figure 2.7. Electricity usage is trending down for small businesses in most regions 32
Figure 2.8. Effective prices for residential customers fell in all regions in 2024 34
Figure 2.9. Effective price trends for small businesses have varied across regions 35
Figure 2.10. Concession customers have lower bills 38
Figure 2.11. Share of residential customers on time-of-use and demand tariffs increases across each region in 2023-24 40
Figure 2.12. Customers on time-of-use and demand tariffs pay more than those on flat tariffs 42
Figure 2.13. The share of customers on standing offers is trending down in New South Wales and South East Queensland 43
Figure 2.14. Customers on market offers tend to pay less than customers on standing offers 43
Figure 2.15. Residential customers with solar panels have lower electricity bills 44
Figure 2.16. Solar feed-in tariffs for residential customers are decreasing 46
Figure 2.17. Solar customers on premium feed-in tariffs continued to receive the largest benefits 46
Figure 2.18. More residential customers continue opting for solar despite the lower solar feed-in tariffs 47
Figure 3.1. Customers participating in behavioural response programs increase significantly since 2022 51
Figure 3.2. Big 3 retailers are responsible for over 95% of residential behavioural demand response program customers 52
Figure 3.3. Higher behavioural demand credits are possible during the summer peak 53
Figure 3.4. Customers take up of electric vehicle tariffs saw a dramatic jump between June 2023 and June 2024 56
Figure 3.5. Big 3 retailers hold the majority of electric vehicle tariff customers 58
Figure 3.6. Electric vehicle tariff customers have larger bills but solar more than compensates 59
Figure 3.7. Electric vehicle tariff customers use much more electricity 60
Figure 3.8. Customers on electric vehicle tariffs pay the least overall per unit of electricity 61
Figure 3.9. Much of electric vehicle tariffs customers additional usage occurs during super off-peak periods 62
Figure 3.10. Virtual power plant plan uptake has almost doubled since June 2022 65
Figure 3.11. NEM customers continue to install batteries 66
Figure 3.12. The growth of battery installations increases our collective storage capacity 67
Figure 3.13. Rates of virtual power plant uptake vary by state, but nationally, participation lags total batteries installed 67
Figure 3.14. Smaller retailers and non-retailer providers supply the majority of virtual power plant customers 69
Figure 3.15. Virtual power plant customers have cheaper bills 70
Figure 3.16. Virtual power plant customers pay lower bills across NEM 71
Figure 3.17. Virtual power plant customers generally use less energy from the grid than other customers 72
Figure 3.18. Virtual power plant customers are paying lower bills than customers with solar and/or batteries 73
Figure 3.19. Customers trade-off higher bills in return for paid off hardware in 7 years on EnergyAustralia Solar Home Bundle 74
Figure 3.20. EnergyAustralia coordinates significant volumes of electricity under its virtual power plant 74
Figure 3.21. Batteries reduce grid usage but virtual power plants further optimise solar generation 76
Figure 3.22. Virtual power plant customers get better prices for their feed-in supply 77
Figure 3.23. Subsidies significantly improve the affordability of solar and battery systems 81
Figure 3.24. Our representative customer without consumer energy resources 82
Figure 3.25. Participating in a virtual power plant sees our representative customer payback their system within 10-years 84
Figure 3.26. Our representative customer receives benefits in excess of their system costs 85
Boxes 33
Box 2.1. What prices and charges make up an energy plan? 33
Box 2.2. Background on customers experiencing financial difficulty 36
Box 2.3. Understanding common tariff structures 39
Box 3.1. Different behavioural demand response programs available 50
Box 3.2. Different electric vehicles charging tariffs 54
Box 3.3. Current electric vehicle tariff limitations and additional considerations 55
Box 3.4. Different virtual power plant offers 63
Box 3.5. New South Wales Government battery and virtual power plant program subsidies 68
Box 4.1. The Australian Consumer Law provides economy-wide consumer protections 91
Box 4.2. Case study (EWOV): Inability to provide billing data around virtual power plant's use of battery, consumer left out of pocket 102
Box 4.3. Access to ombuds schemes for customers of new energy services 106
Box 4.4. Contracts may provide for varying degrees of coordination 110
Appendix Tables 121
Table A.1. Residential customers in weighted sample by region, between 1 July 2023 to 31 December 2024 121
Table B.1. Energy Bill Relief fund programs 131
Appendix Figures 122
Figure A.1. Our groups for customers experiencing financial difficulty 122
*표시는 필수 입력사항입니다.
| 전화번호 |
|---|
| 기사명 | 저자명 | 페이지 | 원문 | 기사목차 |
|---|
| 번호 | 발행일자 | 권호명 | 제본정보 | 자료실 | 원문 | 신청 페이지 |
|---|
도서위치안내: / 서가번호:

우편복사 목록담기를 완료하였습니다.
*표시는 필수 입력사항입니다.
저장 되었습니다.
