 https://www.gov.uk/government/publications/impact-of-growth-of-data-centres-on-energy-consumption


권호기사보기
| 기사명 | 저자명 | 페이지 | 원문 | 기사목차 |
|---|
| 대표형(전거형, Authority) | 생물정보 | 이형(異形, Variant) | 소속 | 직위 | 직업 | 활동분야 | 주기 | 서지 | |
|---|---|---|---|---|---|---|---|---|---|
| 연구/단체명을 입력해주세요. | |||||||||
|
|
|
|
|
|
* 주제를 선택하시면 검색 상세로 이동합니다.
Title page 1
Contents 3
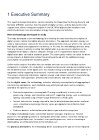
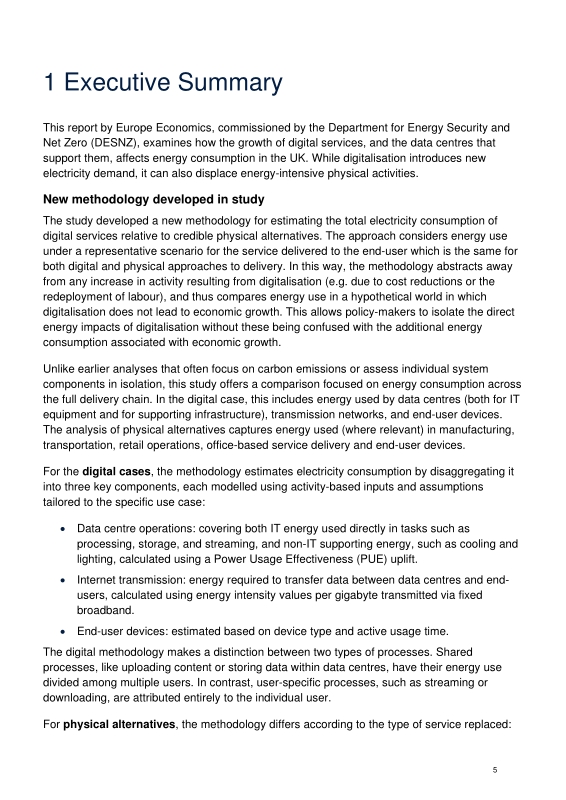
1. Executive Summary 5
2. Introduction 9
2.1. Objective of Research 9
2.2. Our three selected use cases 9
2.3. Representative scenario approach 10
2.4. Structure of Report 11
3. Methodology for Modelling Energy Consumption in Digital Use Cases 12
3.1. Overview of the generic modelling framework 12
3.2. Generic input assumptions 14
3.2.1. Data Centre 14
3.2.2. Internet Transmission 19
3.2.3. End-User device 20
3.3. Specific input assumptions for our three cases 22
3.3.1. Video-streaming 22
3.3.2. ebook 23
3.3.3. AI translation 25
4. Methodology for Modelling Energy Consumption in Physical Counterfactuals 28
4.1. Physical counterfactuals involving manufactured products 28
4.1.1. Overview of approach 28
4.1.2. Input assumptions for Blu-ray 31
4.1.3. Input assumptions for book 40
4.2. Physical counterfactuals involving office-based work 43
4.2.1. Overview of approach 43
4.2.2. Input assumptions for translator 45
5. Results for Test Cases 47
5.1. Video streaming versus Blu-ray 47
Digital scenario 47
Physical counterfactual 51
Comparison of energy consumption 64
5.2. Ebook versus physical book 67
Digital Scenario 67
Physical counterfactual 71
Comparison of energy consumption 77
5.3. AI translation versus human translator 79
Digital scenario 80
Physical counterfactual 83
Comparison of energy consumption 85
6. Insights from Stakeholder Engagement 88
6.1. Overview of engagement methodology 88
6.2. Key themes emerging from discussions 88
General comments 88
PUE values 89
Artificial Intelligence 90
E-book Production 91
Video Streaming 92
7. Conclusions 93
Electricity Consumption 93
Centralised Electricity Use 94
Decarbonisation Readiness 95
Policy Implications 95
Suggested Use Cases for Future Research 96
8. Appendix A: Additional Use Cases for Further Research 99
9. Appendix B: Clarifications on Issues Raised by DESNZ 101
9.1. Treatment of head office energy consumption 101
9.2. Estimating energy consumption for human translation 102
10. Appendix C: List of Stakeholders 103
Tables 7
Table 1.1. UK electricity consumption by use case and scenario (KWh) 7
Table 3.1. Energy per unit of generic IT process 18
Table 3.2. Ranges of PUE for data centres 19
Table 3.3. Energy consumption of transmission (kWh/GB) 20
Table 3.4. Energy consumption for core devices (kWh/hour) 22
Table 3.5. Energy consumption for additional devices (kWh/hour) 22
Table 3.6. Configuration assumptions for the video streaming digital use case 23
Table 3.7. User base and RAM caching assumptions 23
Table 3.8. Configuration assumptions for the video streaming digital use case 24
Table 3.9. User base and RAM caching assumptions 25
Table 3.10. Configuration assumptions for the video streaming digital use case 26
Table 3.11. Input assumptions for digital scenario - AI translation 27
Table 4.1. Share of energy consumption by fuel type for various activities (%) 32
Table 4.2. Manufacturing and Storage energy (kWh/blu-ray) 34
Table 4.3. Assumed transport distances for Blu-ray discs 37
Table 4.4. Fuel consumption intensity (I/km) 38
Table 4.5. Energy content per litre (kWh/L) 38
Table 4.6. Energy efficiency for decarbonised scenario (kWh/km) 39
Table 4.7. Number of Blu-Rays 40
Table 4.8. Share of energy consumption by fuel type for various activities (%) 41
Table 4.9. Manufacturing and Storage energy (kWh/book) 43
Table 4.10. Input assumptions for human translation 46
Table 5.1. Activity volumes and process classification for IT processes 48
Table 5.2. Energy used in each IT process - Video Streaming (kWh) 48
Table 5.3. IT energy attributable to each user (kWh) 49
Table 5.4. Summary of data centre energy consumption (kWh) 49
Table 5.5. Transmission energy attributable to each user (kWh) 49
Table 5.6. Energy used in end-user devices (kWh) 50
Table 5.7. Total energy consumption for representative scenario (kWh) 50
Table 5.8. Total energy consumption for representative scenario (kWh) 50
Table 5.9. Breakdown of energy consumption (%) 51
Table 5.10. Energy Consumption for Manufacturing and Storage (Manufactured with Electricity within the UK) - Electricity (kWh/blu-ray) 52
Table 5.11. Energy Consumption for Manufacturing and Storage (Manufactured within the UK) - other fuel (kWh/blu-ray) 52
Table 5.12. Energy Consumption for Transportation (Manufactured within the UK) - other fuel (kWh/blu-ray) 53
Table 5.13. Energy Consumption for Transportation (Manufactured within the UK) - Decarbonised (kWh/blu-ray) 53
Table 5.14. Energy Consumption for End-User Device - Electricity (kWh) 54
Table 5.15. Total energy for representative scenario (kWh) - (Manufactured within the UK) - Electricity 54
Table 5.16. Energy per hour of video watching - (Manufactured within the UK) - Electricity 55
Table 5.17. Breakdown of energy consumption (%) - (Manufactured within the UK) - Electricity 55
Table 5.18. Total energy for representative scenario (kWh) - (Manufactured within the UK) - All Fuel 56
Table 5.19. Energy per hour of video watching (kWh) - (Manufactured within the UK) - All Fuel 56
Table 5.20. Breakdown of energy consumption (%) - (Manufactured within the UK) - All Fuel 57
Table 5.21. Total energy for representative scenario (kWh) - UK Manufactured - Decarbonisation 57
Table 5.22. Energy per hour of video watching (kWh) - (UK Manufactured) - Decarbonisation 58
Table 5.23. Breakdown of energy consumption (%) - (UK Manufactured) - Decarbonisation 58
Table 5.24. Energy Consumption for Storage and Retailing (Manufactured Overseas) - Electricity (kWh/blu-ray) 59
Table 5.25. Energy Consumption for Storage and Retailing (Manufactured Overseas) - gas (kWh/blu-ray) 59
Table 5.26. Energy Consumption for Transportation (Manufactured Overseas) - other fuel (kWh/blu-ray) 60
Table 5.27. Energy Consumption for Transportation (Manufactured Overseas) - Decarbonised (kWh/blu-ray) 60
Table 5.28. Total energy for representative scenario (kWh) - (Manufactured Overseas) - Electricity 61
Table 5.29. Energy per hour of video watching (kWh) - (Manufactured Overseas) - Electricity 61
Table 5.30. Breakdown of energy consumption (%) - (Manufactured Overseas) - Electricity 61
Table 5.31. Total energy for representative scenario (kWh) - (Manufactured Overseas) - All Fuel 62
Table 5.32. Energy per hour of video watching (kWh) - (Manufactured Overseas) - All Fuel 62
Table 5.33. Breakdown of energy consumption (%) - (Manufactured Overseas) - All Fuel 63
Table 5.34. Total energy for representative scenario (kWh) - Manufactured Overseas - Decarbonisation 63
Table 5.35. Energy per hour of video watching (kWh) - (Manufactured Overseas) - Decarbonisation 64
Table 5.36. Breakdown of energy consumption (%) - (Manufactured Overseas) - Decarbonised 64
Table 5.37. Total electricity consumption attributable to the UK (kWh) 65
Table 5.38. Total energy consumption attributable to the UK (All Fuels, kWh) 65
Table 5.39. Energy use per hour of video viewing attributable to the UK (electricity, kWh/hour) 66
Table 5.40. DRI for Blu-ray streaming (% of energy from electricity) 67
Table 5.41. Activity volumes and process classification for IT processes 68
Table 5.42. Energy used in each IT process - Video Streaming (kWh) 68
Table 5.43. IT energy attributable to each user (kWh) 69
Table 5.44. Summary of data centre energy consumption (kWh) 69
Table 5.45. Transmission energy attributable to each user (kWh) 69
Table 5.46. Energy used in end-user devices (kWh) 70
Table 5.47. Total energy consumption for representative scenario (kWh) 70
Table 5.48. Breakdown of energy consumption (%) 70
Table 5.49. Energy Consumption for Manufacturing and Storage (Manufactured within the UK) - Electricity (kWh/book) 71
Table 5.50. Energy Consumption for Manufacturing and Storage (Manufactured within the UK) - other fuel (kWh/book) 72
Table 5.51. Total energy for representative scenario (kWh) - (Manufactured within the UK) - Electricity 73
Table 5.52. Total energy for representative scenario (kWh) - (Manufactured within the UK) - All Fuel 73
Table 5.53. Breakdown of energy consumption (%) - (Manufactured within the UK) - All Fuel 73
Table 5.54. Total energy for representative scenario (kWh) - UK Manufactured- Decarbonisation 74
Table 5.55. Breakdown of energy consumption (%) - (UK Manufactured) - Decarbonised 74
Table 5.56. Energy Consumption for Storage and Retailing (Manufactured Overseas) - Electricity (kWh/book) 75
Table 5.57. Energy Consumption for Storage and Retailing (Manufactured Overseas) - other fuel (kWh/book) 75
Table 5.58. Total energy for representative scenario (kWh) - (Manufactured Overseas) - Electricity 75
Table 5.59. Total energy for representative scenario (kWh) - (Manufactured Overseas) - All Fuel 76
Table 5.60. Breakdown of energy consumption (%) - (Manufactured Overseas) - All Fuel 76
Table 5.61. Total energy for representative scenario (kWh) - Manufactured Overseas - Decarbonisation 77
Table 5.62. Breakdown of energy consumption (%) - (Manufactured Overseas) - Decarbonised 77
Table 5.63. Total electricity consumption attributable to the UK - ebook versus Physical Book (kWh) 78
Table 5.64. Total energy consumption attributable to the UK (All Fuels, kWh) 78
Table 5.65. DRI for physical books (% of energy from electricity) 79
Table 5.66. IT processes within data centre - AI translation 80
Table 5.67. Energy used in each IT process - AI translation (kWh) 81
Table 5.68. IT energy attributable to each user (kWh) 81
Table 5.69. Summary of data centre energy consumption (kWh) 81
Table 5.70. Transmission energy attributable to each user (kWh) 82
Table 5.71. Energy used in end-user devices 82
Table 5.72. Total energy for representative scenario (kWh) 82
Table 5.73. Breakdown of energy consumption (%) 83
Table 5.74. Time required to translate document 83
Table 5.75. Electricity consumed in translator's office 84
Table 5.76. Transmission energy attributable to each user (kWh) 84
Table 5.77. Energy used in end-user devices 84
Table 5.78. Total energy consumption for representative scenario (kWh) 85
Table 5.79. Breakdown of energy consumption (%) 85
Table 5.80. Total energy consumption - AI versus Human Translation (kWh) 86
Table 7.1. Total electricity consumption (kWh) in the UK 93
Table 7.2. Centralised Electricity Consumption by use-case (%) 94
Table 7.3. Decarbonisation Readiness (%) 95
Table 8.1. How our suggested additional use cases cover all major categories of data centre usage 99
Figures 14
Figure 3.1. Modelling framework for estimating energy consumption in digital use cases 14
Figure 4.1. Modelling framework for estimating energy consumption involving manufactured products 30
Figure 4.2. Modelling framework for estimating energy consumption involving office-based work 45
*표시는 필수 입력사항입니다.
| 전화번호 |
|---|
| 기사명 | 저자명 | 페이지 | 원문 | 기사목차 |
|---|
| 번호 | 발행일자 | 권호명 | 제본정보 | 자료실 | 원문 | 신청 페이지 |
|---|
도서위치안내: / 서가번호:

우편복사 목록담기를 완료하였습니다.
*표시는 필수 입력사항입니다.
저장 되었습니다.
