
 대표어
대표어
 https://www.accc.gov.au/about-us/publications/serial-publications/gas-inquiry-2017-30-reports/gas-inquiry-september-2025-interim-report
권호기사보기
| 기사명 | 저자명 | 페이지 | 원문 | 기사목차 |
|---|
결과 내 검색
동의어 포함
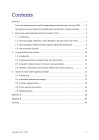
Title page 1
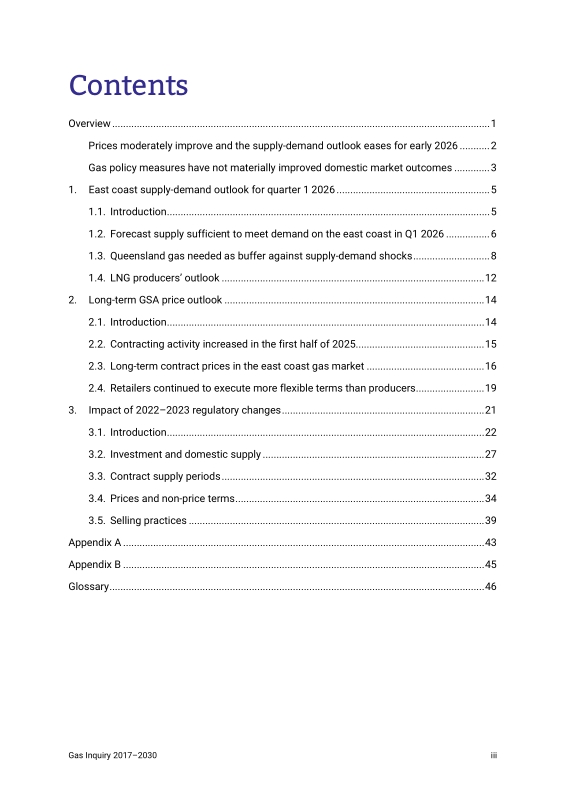
Contents 3
Acknowledgment of country 2
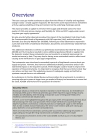
Overview 4
Prices moderately improve and the supply-demand outlook eases for early 2026 5
Gas policy measures have not materially improved domestic market outcomes 6
1. East coast supply-demand outlook for quarter 1 2026 8
1.1. Introduction 8
1.2. Forecast supply sufficient to meet demand on the east coast in Q1 2026 9
1.2.1. Insufficient east coast supply forecast for quarters 2 and 3 in 2026 10
1.3. Queensland gas needed as buffer against supply-demand shocks 11
1.3.1. Tight southern supply balance poses challenges to Iona storage injections 12
1.3.2. High variability of gas demand for power generation 14
1.3.3. Northern Territory supply 14
1.4. LNG producers' outlook 15
2. Long-term GSA price outlook 17
2.1. Introduction 17
2.2. Contracting activity increased in the first half of 2025 18
2.3. Long-term contract prices in the east coast gas market 19
2.3.1. Producer prices have eased for 2026 supply 19
2.3.2. Producer prices for 2027 supply slightly higher than for 2026 20
2.3.3. The majority of contracts were fixed-price rather than commodity-linked contracts 21
2.4. Retailers continued to execute more flexible terms than producers 22
3. Impact of 2022-2023 regulatory changes 24
3.1. Introduction 25
3.2. Investment and domestic supply 30
3.2.1. Producers decided to pause investment in response to the Emergency Price Order & development of the Gas Code 31
3.2.2. While investment has resumed, the perceived risk of further intervention may be affecting investment decisions 31
3.2.3. The Gas Code's exemption framework has had some success in incentivising domestic supply, but there is doubt about the additionality of some of the gas 32
3.2.4. LNG producers had mixed views on the effect the 2023 ADGSM changes had on their incentives to supply the domestic market 33
3.2.5. The 2022 changes to the HoA reportedly had little impact on LNG producers' supply strategies 35
3.3. Contract supply periods 35
3.3.1. The supply periods offered by some producers have shortened in response to the Gas Code and ADGSM 36
3.4. Prices and non-price terms 37
3.4.1. Prices continue to be driven by market conditions, rather than the regulatory instruments 39
3.4.2. There has been little impact on non-price terms, but some producers are now factoring regulatory risk into contracts 41
3.5. Selling practices 42
3.5.1. Producers share buyers' concerns about the impact of the Gas Code's EOI provisions 43
3.5.2. Producers also reported the Gas Code has affected their ability to conduct timely and effective negotiations 44
3.5.3. Producers pointed to the increased administrative burden associated with the conduct & reporting provisions 45
Appendix A 46
Appendix B 48
Glossary 49
Tables 16
Table 1.1. LNG producers' forecast supply and contracted sales in quarter 1 2026 (PJ) 16
Table 2.1. Count of long-term gas supply contracts for supply in 2026 and 2027 18
Table 2.2. GSAs by pricing mechanism, agreed between January and June 2025 22
Table 3.1. Overview of Code, HoA and ADGSM impacts based on June and September 2025 report findings 28
Figures 26
Figure 3.1. Regulatory instruments implemented or amended in 2022-23 26
Figure 3.2. Gas buyer observations on availability of gas and the influence of the Gas Code and ADGSM on supply 30
Figure 3.3. LNG producers' domestic sales and third-party purchases (PJ) 35
Figure 3.4. Gas buyer observations on producer supply periods 36
Figure 3.5. Gas buyer observations on producer prices and non-price terms 38
Figure 3.6. Gas buyer observations on producer selling practices 43
Charts 10
Chart 1.1. Reasons for change in quarter 1 2026 east coast supply-demand outlook 10
Chart 1.2. Quarterly supply-demand balance for the east coast in 2026 (PJ) 11
Chart 1.3. Regional supply-demand outlooks for quarter 1 2026 (PJ) 12
Chart 1.4. Year-on-year Iona underground storage levels (2021-2025) 13
Chart 1.5. Quarter 1 southern supply-demand balance and Iona injections (2019-2026) 13
Chart 1.6. Gas powered generation forecast v actual consumption (2023-2025) 14
Chart 1.7. Change in LNG producer's outlook in quarter 1 2026 15
Chart 2.1. Cumulative volumes contracted under long-term GSAs for supply years 2021-2027 19
Chart 2.2. Gas commodity prices in the east coast gas market for 2026 supply 20
Chart 2.3. Gas commodity prices in the east coast gas market for 2027 supply 21
Chart 2.4. GSA take-or-pay multipliers and load factors for supply in 2026 and 2027 23
Boxes 42
Box 3.1. Producer observations on non-price terms 42
Appendix Tables 46
Table 1.1/Table 1.2. Comparison of forecast vs actuals for Quarter 1 2025 46
*표시는 필수 입력사항입니다.
| 전화번호 |
|---|
| 기사명 | 저자명 | 페이지 | 원문 | 기사목차 |
|---|
| 번호 | 발행일자 | 권호명 | 제본정보 | 자료실 | 원문 | 신청 페이지 |
|---|
도서위치안내: / 서가번호:

우편복사 목록담기를 완료하였습니다.
*표시는 필수 입력사항입니다.
저장 되었습니다.
