
 대표어
대표어
 https://www.bruegel.org/working-paper/understanding-us-foreign-military-sales-globally-2008-analysis-new-dataset


권호기사보기
| 기사명 | 저자명 | 페이지 | 원문 | 기사목차 |
|---|
결과 내 검색
동의어 포함
Title page 1
Contents 1
1. Introduction 2
2. How the US exports military equipment 4
3. FMS notifications: a new database 6
4. Analysing FMS notifications since 2008 8
4.1. Values of FMS notifications stable in real terms, but 2024 unusually high 9
4.2. Geographical distribution of the sales 11
4.3. Air, land and sea forces sales are balanced 11
5. Understanding US FMS by region 12
5.1. Europe 12
5.2. Near East and South Asia 13
5.3. East Asia and the Pacific 14
5.4. Americas and Africa 15
6. Details of specific system sales 16
6.1. Type of equipment by region 16
6.2. Geographical distribution of sales of high-value equipment 20
6.3. Additional equipment 23
7. Conclusions 26
References 27
Annex 1 29
Annex 2 31
Tables 3
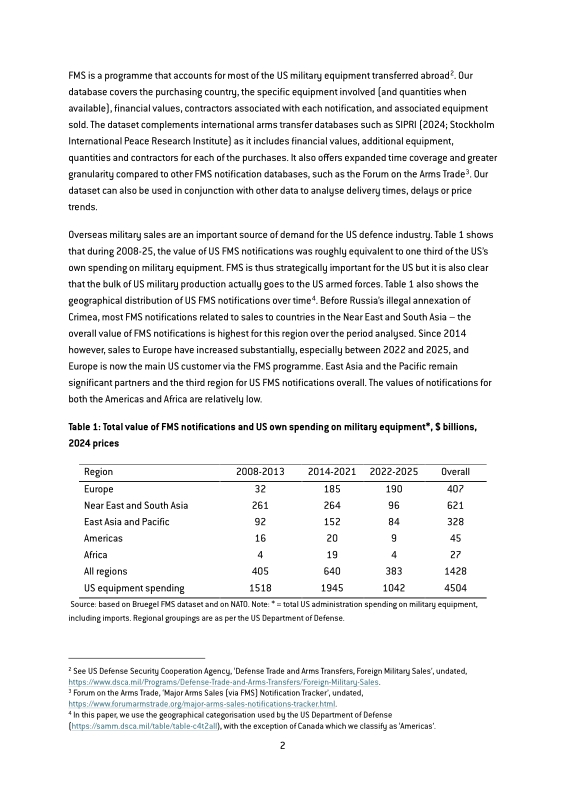
Table 1. Total value of FMS notifications and US own spending on military equipment, 2024 prices 3
Table 2. F-35 fighter aircraft, FMS notifications, 2017-2025 24
Table 3. FMS notifications for Patriot air defence systems (2017-2025) 24
Table 4. FMS notifications for Patriot Advanced Capability missiles (2017-2025) 25
Figures 4
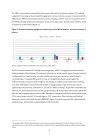
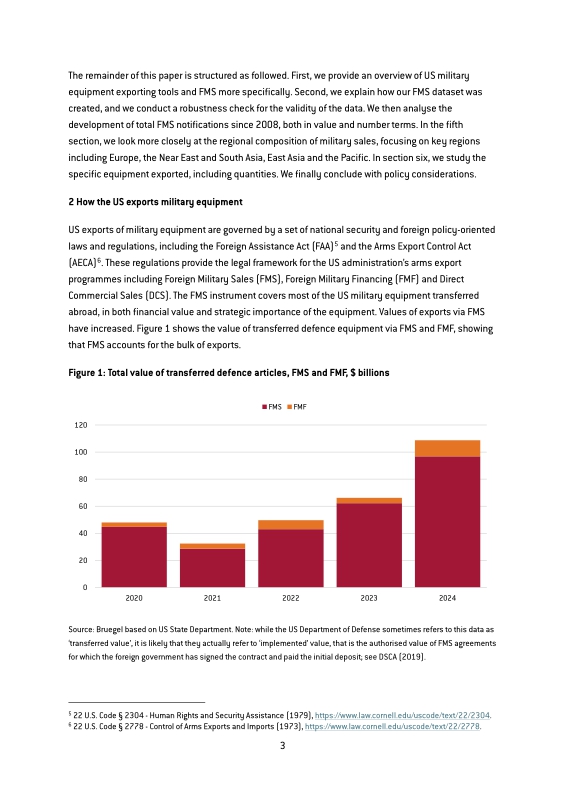
Figure 1. Total value of transferred defence articles, FMS and FMF, $ billions 4
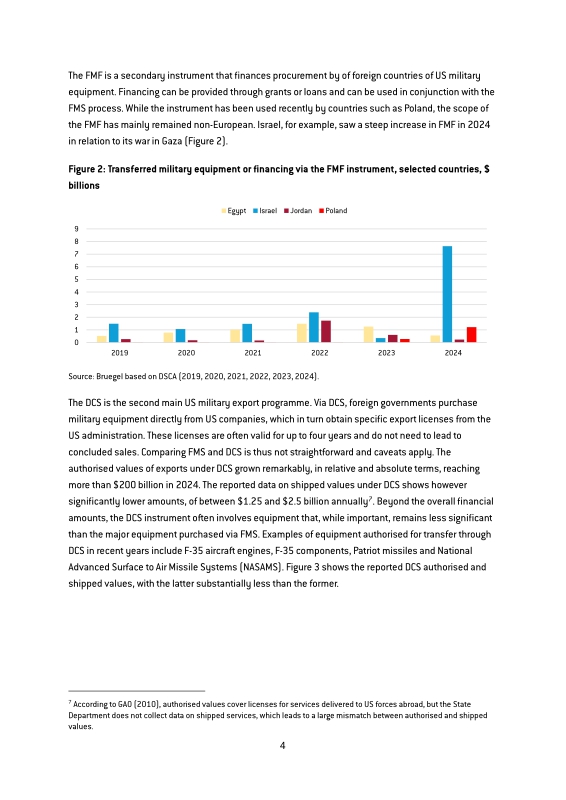
Figure 2. Transferred military equipment or financing via the FMF instrument, selected countries, $ billions 5
Figure 3. DCS total authorised value (left panel) and DCS shipped values (right panel), $ billions 6
Figure 4. FMS notifications and FMS value of implemented sales, current $ billions 8
Figure 5. Number of FMS notifications per year 9
Figure 6. Values of FMS notifications, $ billions, constant 2024 prices 10
Figure 7. Value of FMS notifications as a share of US spending on military equipment 10
Figure 8. Value of FMS notifications by destination region, $ billions, 2024 prices 11
Figure 9. Value of FMS notifications by military branch, $ billions, 2024 prices 12
Figure 10. Value of FMS notifications, selected European countries, $ billions, 2024 prices 13
Figure 11. FMS notifications, selected countries in the Near East and South Asia, $ billions, 2024 prices 14
Figure 12. Value of FMS notifications, selected East Asia and Pacific countries, $ billions, 2024 prices 15
Figure 13. Value of FMS notifications, selected countries in the Americas and Africa, $ billions, 2024 prices 16
Figure 14. Value of FMS notifications by type, $ billions, 2024 prices 17
Figure 15. Value of FMS notifications related to Europe by type, $ billions, 2024 prices 18
Figure 16. Value of FMS notifications related to the Near East and South Asia by type, $ billions, 2024 prices 18
Figure 17. Value of FMS notifications related to East Asia and Pacific by type, $ billions, 2024 prices 19
Figure 18. Value of FMS notifications related to Africa and the Americas by type, $ billions, 2024 prices 19
Figure 19. High-value type of equipment by region (2008-2025) 20
Figure 20. High-value type of equipment by region (2008-2013) 21
Figure 21. High-value type of equipment by region (2014-2021) 22
Figure 22. High-value type of equipment by region (2022-2025) 23
Annex Tables 31
Table A1. LLM prompts 31
Annex Figures 29
Figure A1. Example of an FMS notification for sale to Finland 29
Figure A2. High-value main equipment by region (2008-2025) 33
Figure A3. High-value main equipment by region (2008-2013) 33
Figure A4. High-value main equipment by region (2014-2021) 34
Figure A5. High-value main equipment by region (2022-2025) 34
*표시는 필수 입력사항입니다.
| 전화번호 |
|---|
| 기사명 | 저자명 | 페이지 | 원문 | 기사목차 |
|---|
| 번호 | 발행일자 | 권호명 | 제본정보 | 자료실 | 원문 | 신청 페이지 |
|---|
도서위치안내: / 서가번호:

우편복사 목록담기를 완료하였습니다.
*표시는 필수 입력사항입니다.
저장 되었습니다.
