
 대표어
대표어
 https://www.usitc.gov/sites/default/files/publications/332/working_papers/2025_disaggregating_us_labor_statistics_for_the_gtap_computable_general_equilibrium_model.pdf
권호기사보기
| 기사명 | 저자명 | 페이지 | 원문 | 기사목차 |
|---|
결과 내 검색
동의어 포함
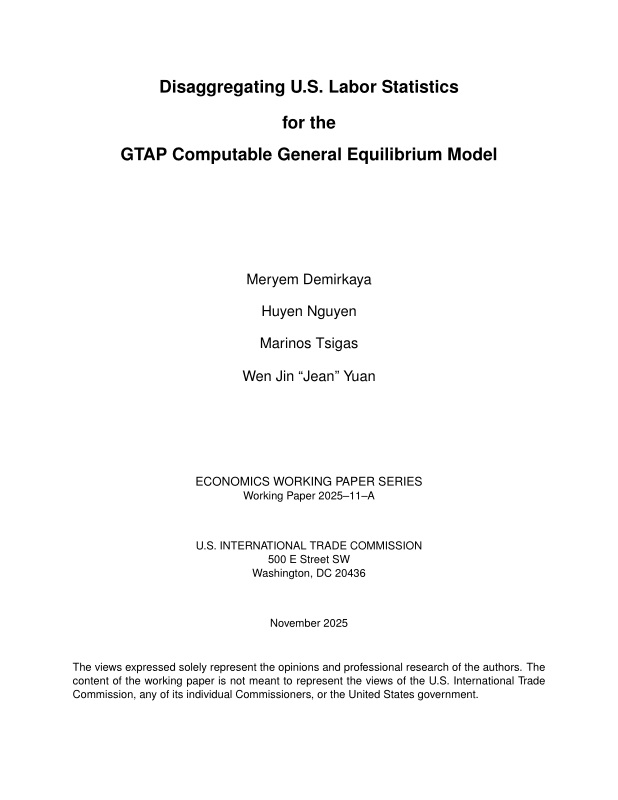
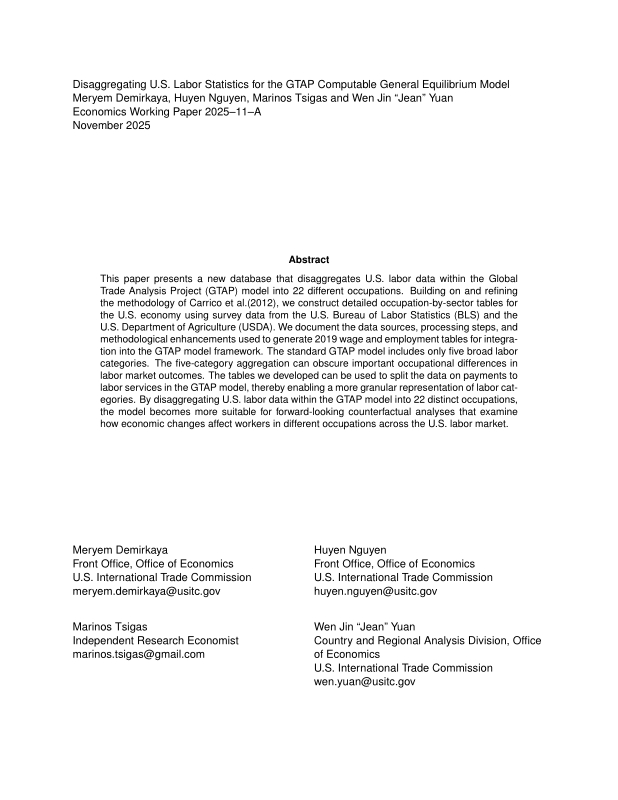
Title page 1
Contents 1
Abstract 2
1. Introduction 3
2. Data Sources 3
2.1. BLS-Occupational Employment and Wage Statistics (OEWS) 3
2.2. USDA Census of Agriculture 6
3. Labor Disaggregation Methodology 8
3.1. Mapping NAICS industries with GTAP sectors 9
3.2. Split Occupational Estimates 9
3.3. Generating Matrices by NAICS Industry and Occupation 13
3.4. Aggregating Employment and Wage Bill Estimates by GTAP Model Sector and Occupation 13
3.5. Plugging into GTAP Standard Model 13
3.6. Generating Mean Annual Wage by GTAP Model Sector and Occupation 14
3.7. Additional Calculations 14
4. Descriptive Statistics 14
5. Conclusions 20
References 21
Tables 5
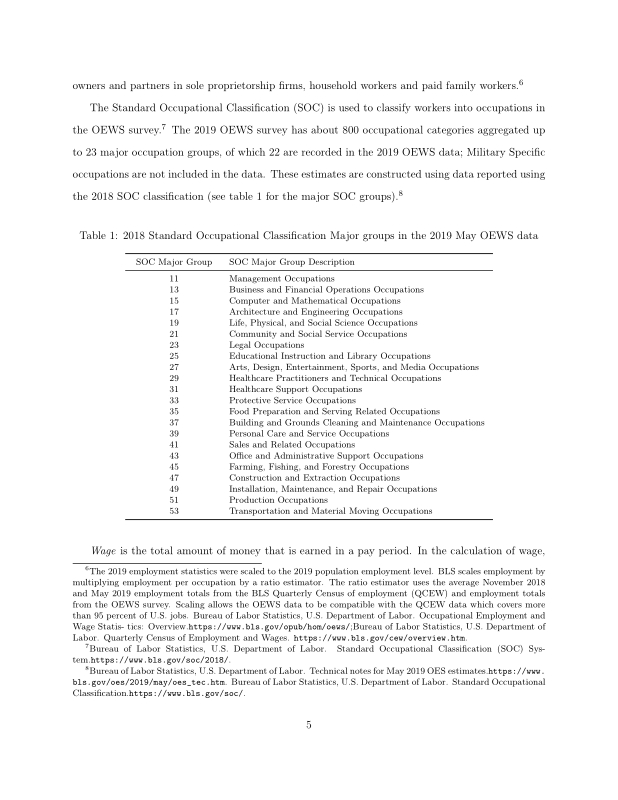
Table 1. 2018 Standard Occupational Classification Major groups in the 2019 May OEWS data 5
Table 2. Share values for NAICS codes mapped into multiple GTAP sectors 11
Table 3. Number of Employments and Share of Occupational Employment in GTAP sectors as a percentage of Total Employment in the Occupation 18
Figures 15
Figure 1. U.S. average wage in 2019, by occupation, in dollars 15
Figure 2. U.S. average wage, by GTAP sector, dollars/year 16
Figure 3. U.S. total employment in 2019, by occupation, in million workers 17
Figure 4. U.S. total employment, by GTAP sector 17
Appendix Tables 23
Appendix Table 1. GTAP sector descriptions 23
Appendix Table 2. A concordance mapping NAICS to GTAP sectors 25
Appendix Table 3. GTAP-Total Employment Matrix (2019), by number of workers 32
Appendix Table 4. GTAP-Mean Annual Wage Matrix (2019), by US dollar 33
Appendix Table 5. GTAP-Wage Bill Matrix (2019), by US dollar 34
*표시는 필수 입력사항입니다.
| 전화번호 |
|---|
| 기사명 | 저자명 | 페이지 | 원문 | 기사목차 |
|---|
| 번호 | 발행일자 | 권호명 | 제본정보 | 자료실 | 원문 | 신청 페이지 |
|---|
도서위치안내: / 서가번호:

우편복사 목록담기를 완료하였습니다.
*표시는 필수 입력사항입니다.
저장 되었습니다.
