
 대표어
대표어
 https://itif.org/publications/2025/12/08/still-insignificant-an-update-on-concentration-in-the-us-economy/

권호기사보기
| 기사명 | 저자명 | 페이지 | 원문 | 기사목차 |
|---|
결과 내 검색
동의어 포함
Title page 1
Contents 2
KEY TAKEAWAYS 1
INTRODUCTION 3
THE GREAT CONCENTRATION PANIC 3
CENSUS BUREAU CONCENTRATION DATA 4
Concentration in 2022 6
Changes in Concentration 6
Industries With High Increases in Concentration From 2017 to 2022 9
Advanced Technology Sectors 11
INCORPORATING TRADE DATA INTO THE ANALYSIS 12
Concentration in 2022 Was Lower When Imports and Exports Are Incorporated 13
Concentration Decreases Over Time When Imports and Exports Are Incorporated 14
The Negative Correlation Between C4 Concentration Ratio and Changes in Percentage Point Is More Pronounced When Including Net Imports 15
Highly Concentrated Industries When Net Imports Are Considered 15
HOW SHOULD ANTITRUST MOVE FORWARD? 16
CONCLUSION 17
ENDNOTES 18
Tables 5
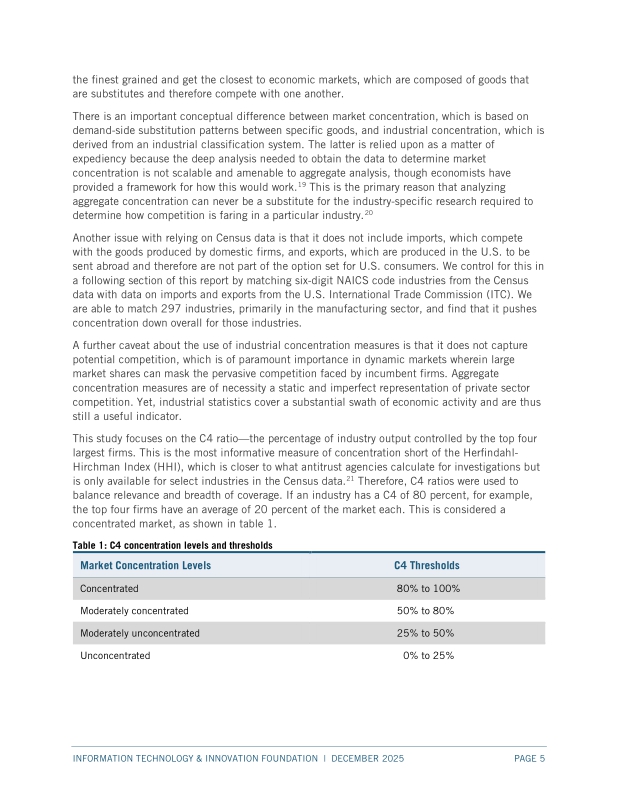
Table 1. C4 concentration levels and thresholds 5
Figures 6
Figure 1. Count of C4 concentration levels among all 889 six-digit NAICS industries, 2022 6
Figure 2. Range of C4 concentration changes among six-digit NAICS industries, 2017-2022 7
Figure 3. Change in C4 concentration levels among six-digit NAICS industries, 2017-2022 (left to right) 7
Figure 4. Relationship between C4 ratio in 2017 and change in C4, 2017-2022 8
Figure 5. Percentage point increase to 2022 for industries with 2017 C4 ratio of 60 percent or more 8
Figure 6. Top 20 industries with the highest C4 ratios in 2017 and their percentage point changes, 2017-2022 9
Figure 7. Top 20 industries with the highest percentage point increase in the C4 ratio, 2017-2022 10
Figure 8. Number of advanced technology industries in C4 concentration ratio groups, 2017 and 2022 11
Figure 9. Change in C4 concentration levels among 135 advanced industries, 2017-2022 (left to right) 12
Figure 10. Ranges of C4 concentration in 2022 NAICS codes, considering imports and exports 14
Figure 11. Change in C4 concentration among six-digit NAICS industries, 2017-2022, considering trade 14
Figure 12. Relationship between C4 ratio in 2017 and change through 2022, considering trade 15
Figure 13. Change in C4 among most highly concentrated industries, 2017-2022, factoring trade 16
*표시는 필수 입력사항입니다.
| 전화번호 |
|---|
| 기사명 | 저자명 | 페이지 | 원문 | 기사목차 |
|---|
| 번호 | 발행일자 | 권호명 | 제본정보 | 자료실 | 원문 | 신청 페이지 |
|---|
도서위치안내: / 서가번호:

우편복사 목록담기를 완료하였습니다.
*표시는 필수 입력사항입니다.
저장 되었습니다.
