
 대표어
대표어
 https://itif.org/publications/2025/12/15/mapping-industrial-strength-us-machine-tool-production-and-consumption/
권호기사보기
| 기사명 | 저자명 | 페이지 | 원문 | 기사목차 |
|---|
결과 내 검색
동의어 포함
Title page 1
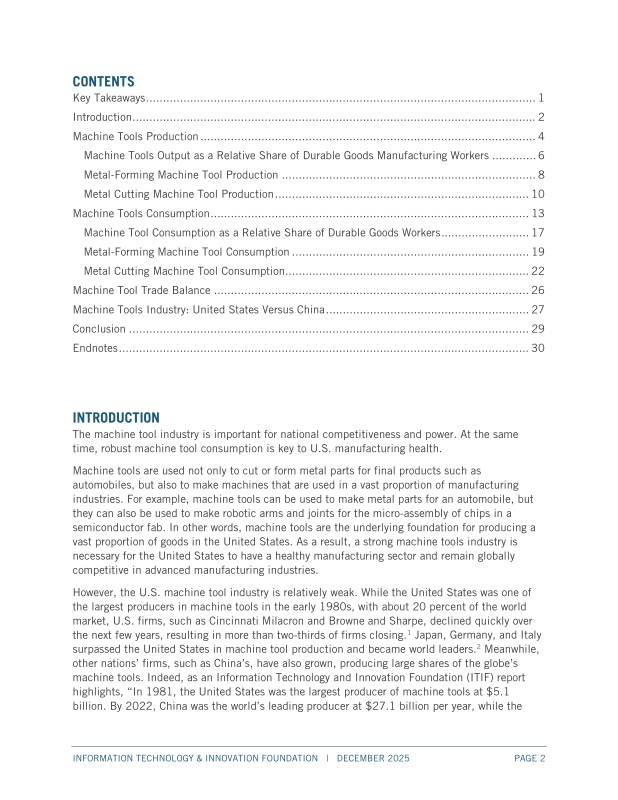
Contents 2
Key Takeaways 1
Introduction 2
Machine Tools Production 4
Machine Tools Output as a Relative Share of Durable Goods Manufacturing Workers 6
Metal-Forming Machine Tool Production 8
Metal Cutting Machine Tool Production 10
Machine Tools Consumption 13
Machine Tool Consumption as a Relative Share of Durable Goods Workers 17
Metal-Forming Machine Tool Consumption 19
Metal Cutting Machine Tool Consumption 22
Machine Tool Trade Balance 26
Machine Tools Industry: United States Versus China 27
Conclusion 29
Endnotes 30
Tables 3
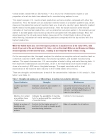
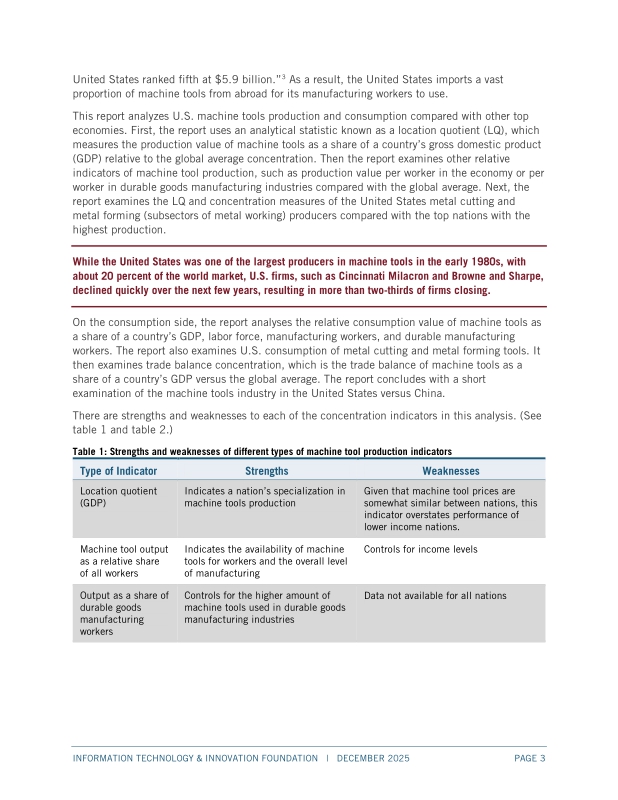
Table 1. Strengths and weaknesses of different types of machine tool production indicators 3
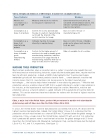
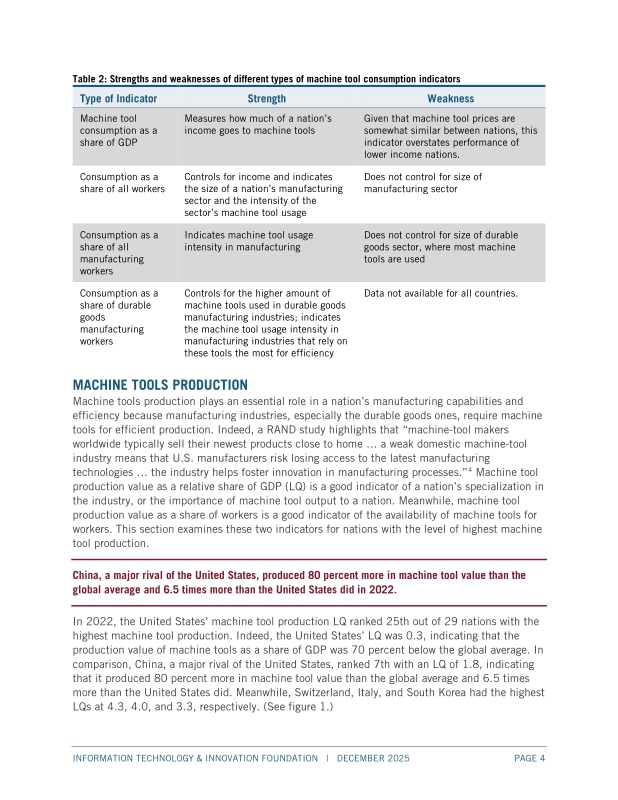
Table 2. Strengths and weaknesses of different types of machine tool consumption indicators 4
Figures 5
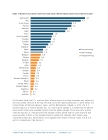
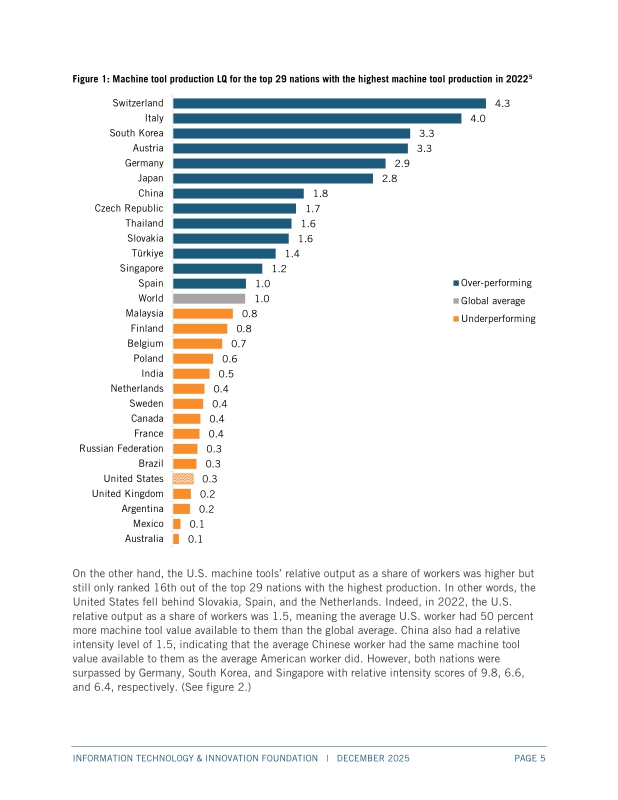
Figure 1. Machine tool production LQ for the top 29 nations with the highest machine tool production in 2022 5
Figure 2. Machine tool output as a share of workers relative to the global average for the 29 nations with the highest machine tool production in 2022 6
Figure 3. Machine tool output as a relative share of durable goods manufacturing workers for a subset of OECD nations with the highest... 7
Figure 4. Metal-forming machine tool production LQ for the top 19 nations with the highest machine tool production in 2022 8
Figure 5. Metal-forming machine tool output as a relative share of workers for the top 19 nations with the highest machine tool production in 2022 9
Figure 6. Metal-forming machine tool output as a relative share of durable goods manufacturing workers for a subset of OECD nations... 10
Figure 7. Metal cutting machine tool production LQ for the top 19 nations with the highest machine tool production in 2022 11
Figure 8. Metal cutting machine tool output as a relative share of workers for the top 19 nations with the highest machine tool production in 2022 12
Figure 9. Metal cutting machine tool output as a relative share of durable goods manufacturing for a subset of OECD nations with the highest... 13
Figure 10. Machine tool consumption value as a relative share of GDP for the top 29 nations with the highest machine tool consumption in 2022 14
Figure 11. Machine tool consumption value as a relative share of workers for the top 29 nations with the highest machine tool consumption in 2022 16
Figure 12. Machine tool consumption value as a relative share of manufacturing workers for the top 28 nations with the highest machine... 17
Figure 13. Machine tool consumption as a relative share of durable goods manufacturing workers for a subset of OECD nations with the highest... 18
Figure 14. Metal-forming machine tool consumption as a relative share of GDP for the top 19 nations with the highest machine tool consumption in 2022 19
Figure 15. Metal-forming machine tool consumption as a relative share of workers for the top 19 nations with the highest machine tool consumption in 2022 20
Figure 16. Metal-forming machine tool consumption as a relative share of manufacturing workers for the top 18 nations with the highest... 21
Figure 17. Metal-forming machine tool consumption as a relative share of durable goods manufacturing workers for a subset of OECD nations... 22
Figure 18. Metal cutting machine tool consumption as a relative share of GDP for the top 19 nations with the highest machine tool consumption in 2022 23
Figure 19. Metal cutting machine tool consumption as a relative share of workers for the top 19 nations with the highest machine tool consumption in 2022 24
Figure 20. Metal cutting machine tool consumption as a relative share of manufacturing workers for the top 19 nations with the highest... 25
Figure 21. Metal cutting machine tool consumption as a relative share of durable goods manufacturing workers for a subset of OECD nations... 26
Figure 22. Machine tool trade balance index for the top 24 nations with the highest machine tool imports and exports in 2022 27
Figure 23. U.S. and Chinese firms' global market shares in machinery and equipment 28
*표시는 필수 입력사항입니다.
| 전화번호 |
|---|
| 기사명 | 저자명 | 페이지 | 원문 | 기사목차 |
|---|
| 번호 | 발행일자 | 권호명 | 제본정보 | 자료실 | 원문 | 신청 페이지 |
|---|
도서위치안내: / 서가번호:

우편복사 목록담기를 완료하였습니다.
*표시는 필수 입력사항입니다.
저장 되었습니다.
