대표어
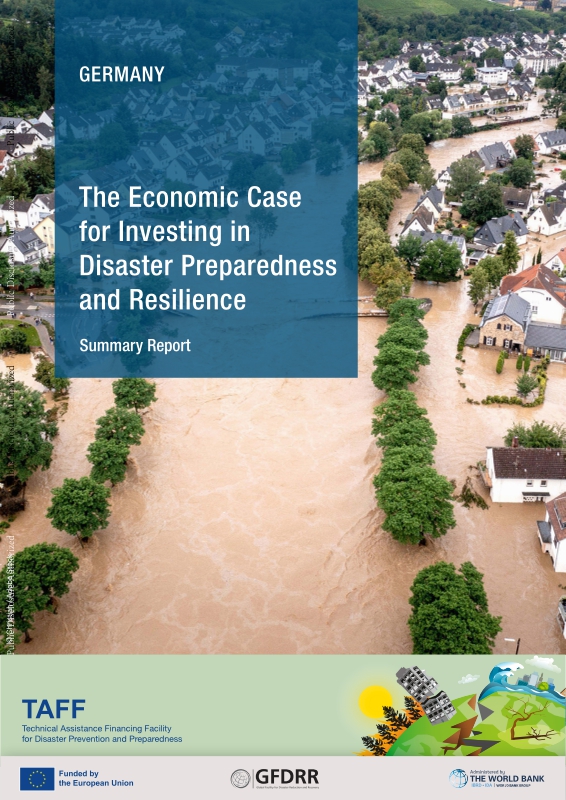
 https://documents.worldbank.org/en/publication/documents-reports/documentdetail/099122325103032001
권호기사보기
| 기사명 | 저자명 | 페이지 | 원문 | 기사목차 |
|---|
결과 내 검색
동의어 포함
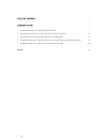
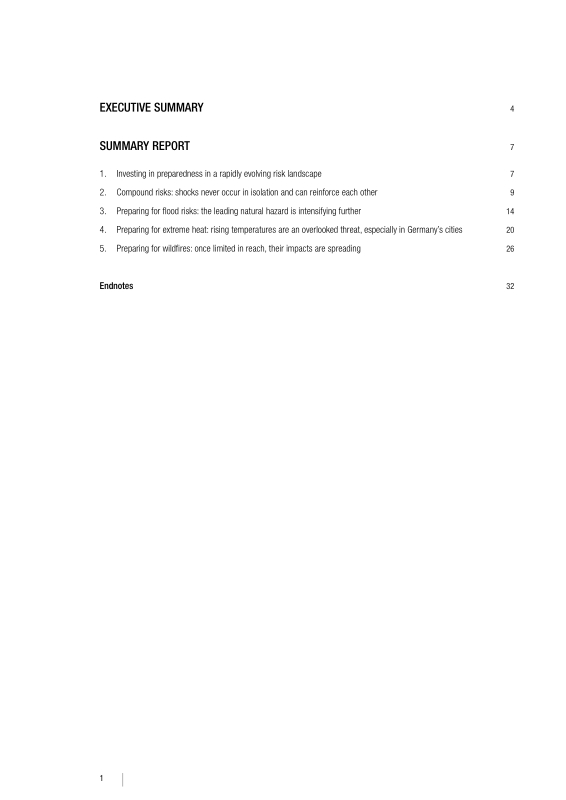
Title page 1
Contents 3
Acknowledgments 5
Executive Summary 6
Summary Report 9
1. Investing in preparedness in a rapidly evolving risk landscape 9
2. Compound risks: shocks never occur in isolation and can reinforce each other 11
3. Preparing for flood risks: the leading natural hazard is intensifying further 16
4. Preparing for extreme heat: rising temperatures are an overlooked threat, especially in Germany's cities 22
5. Preparing for wildfires: once limited in reach, their impacts are spreading 28
Endnotes 34
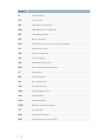
Tables 7
Table 1. Summary of key recommendations for strengthening multi-hazard preparedness 7
Table 2. Climate risks by impact types and sectors without and with adaptation measures 12
Table 3. Recommendations and priority policy actions for Germany to move forward 33
Figures 6
Figure 1. Average benefit-cost ratios (BCR) of wildfire, flood, and heat adaptation measures in Germany 6
Figure 2. European regions exposed to multihazards, identified absolute population exposure 9
Figure 3. Germany's mid- and long-term multihazard climate risk hotspots 11
Figure 4. Global risks, ranked by severity over the short and long terms 13
Figure 5. Average benefit-cost ratios (BCR) of wildfire, flood, and heat adaptation measures in Germany 15
Figure 6. Total increase of exposed settlement area (km2) and their respective growth rates, 2016-25, in different flood depths for a 1-in-100-year flood 16
Figure 7. Settlement flood hazard exposure and exposure growth from 2016-25 for a 1-in-100 year flood return period 17
Figure 8. Exposure of critical infrastructure assets to 1-in-10 and 1-in-100 floods 18
Figure 9. Projected increase in flood exposure of settlements under the most pessimistic climate change scenario (SSP5-RCP8.5) 19
Figure 10. Physical flood protection coverage, proxied by dike density (dike length relative to exposed area) 20
Figure 11. Average BCRs of selected flood adaptation measures in Germany 21
Figure 12. Number of days with over 30°C in Germany and trend over time 22
Figure 13. Cross-city comparison of projected heat wave days per year for two climate scenarios 23
Figure 14. Berlin: Spatial differences in peak temperature (in °C WBGT) and heat exposure projections 24
Figure 15. Heat vulnerability in German cities: additional heat-related deaths per million inhabitants for each day over 20°C 25
Figure 16. Estimated number of heat-related deaths and labor hour losses, with avoided economic costs, in 2100 under two scenarios 26
Figure 17. Average BCRs of selected heat adaptation measures in Germany 27
Figure 18. Number of fires and burnt area (2006-25) 28
Figure 19. Direct damage from wildfires (2018-21) 29
Figure 20. Wildland-industrial interface map and ratio of wildland-industrial interface area over total fuel area map 29
Figure 21. Average BCRs of selected wildfire adaptation measures in Germany 30
Boxes 15
Box 1. Benefit cost ratios: Caveats and limitations 15
*표시는 필수 입력사항입니다.
| 전화번호 |
|---|
| 기사명 | 저자명 | 페이지 | 원문 | 기사목차 |
|---|
| 번호 | 발행일자 | 권호명 | 제본정보 | 자료실 | 원문 | 신청 페이지 |
|---|
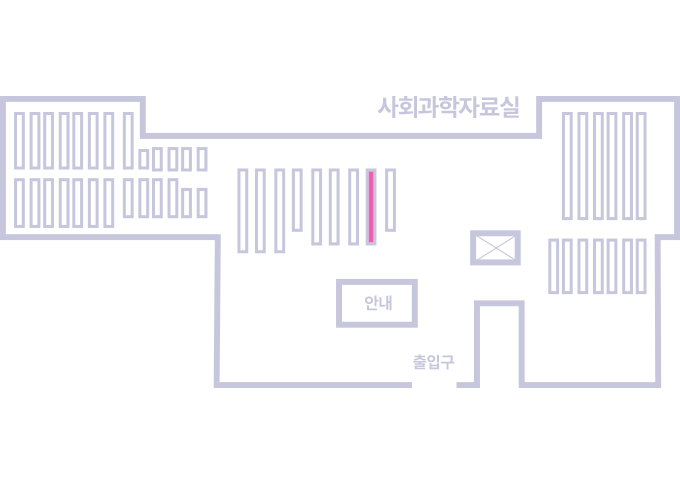
도서위치안내: / 서가번호:
우편복사 목록담기를 완료하였습니다.
*표시는 필수 입력사항입니다.
저장 되었습니다.