
 대표어
대표어
 https://www.gao.gov/products/gao-26-107285
권호기사보기
| 기사명 | 저자명 | 페이지 | 원문 | 기사목차 |
|---|
결과 내 검색
동의어 포함
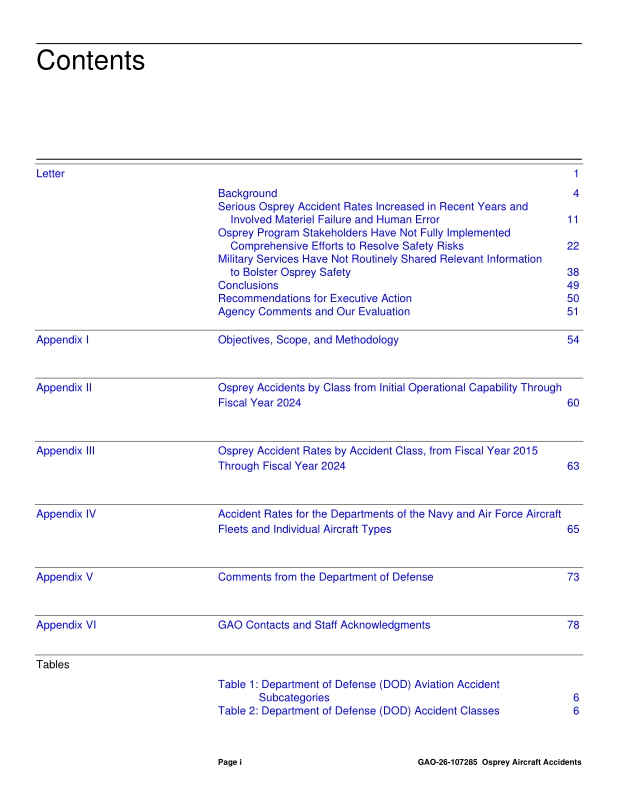
Title page 1
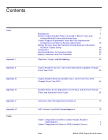
Contents 4
Highlights 2
Letter 7
Background 10
Marine Corps, Air Force, and Navy Osprey Variants 10
Aviation Accident Categories and Severity Classes 12
Osprey Accidents and Fatalities 13
DOD Aviation Accident Rate Calculation 14
Recent Serious Osprey Accidents, and Subsequent Grounding Periods 15
Osprey Program Roles 16
Serious Osprey Accident Rates Increased in Recent Years and Involved Materiel Failure and Human Error 17
Serious Osprey Accident Rates Increased in Fiscal Years 2023 and 2024 17
Serious Osprey Accident Rates Generally Exceeded the Rates for Other Aircraft Types 21
Most Serious Accidents Involved Causal Factors Related to Materiel Failure and Human Error 23
Osprey Program Stakeholders Have Not Fully Implemented Comprehensive Efforts to Resolve Safety Risks 28
Program Stakeholders Have Not Fully Identified and Responded to All Safety Risks 28
Osprey Program Stakeholders Have Not Established Comprehensive Mechanisms to Oversee Efforts to Resolve Safety Risks 38
Military Services Have Not Routinely Shared Relevant Information to Bolster Osprey Safety 44
Military Services Have Not Proactively Shared Hazard and Accident Reporting Information Among the Joint Osprey Community 44
Military Services Have Not Routinely Met to Review and Share Aircraft Knowledge and Emergency Procedures 48
Actions to Improve Maintenance Information Sharing Are Incomplete 51
Conclusions 55
Recommendations for Executive Action 56
Agency Comments and Our Evaluation 57
Appendix I: Objectives, Scope, and Methodology 60
Appendix II: Osprey Accidents by Class from Initial Operational Capability Through Fiscal Year 2024 66
Appendix III: Osprey Accident Rates by Accident Class, from Fiscal Year 2015 Through Fiscal Year 2024 69
Appendix IV: Accident Rates for the Departments of the Navy and Air Force Aircraft Fleets and Individual Aircraft Types 71
Appendix V: Comments from the Department of Defense 79
Appendix VI: GAO Contacts and Staff Acknowledgments 84
Tables 4
Table 1. Department of Defense (DOD) Aviation Accident Subcategories 12
Table 2. Department of Defense (DOD) Accident Classes 12
Table 3. Key Roles for Osprey Program Management 16
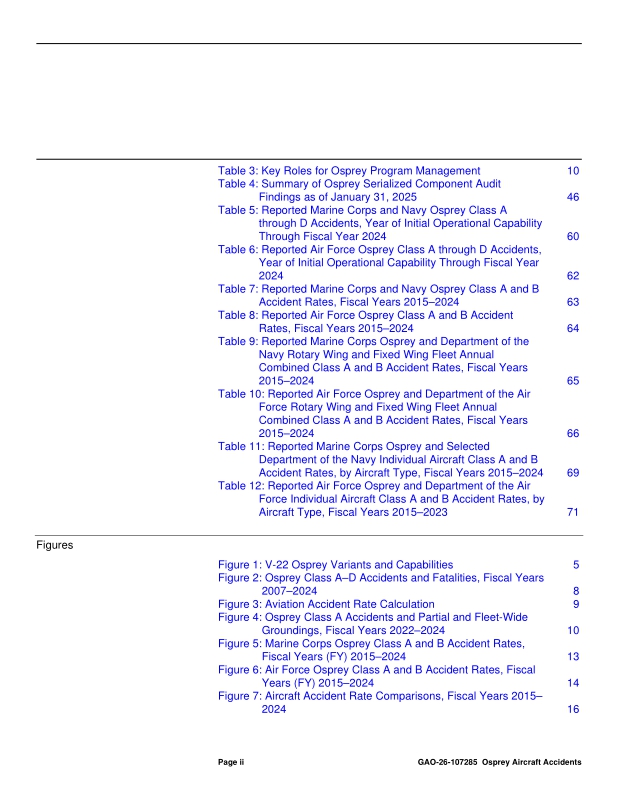
Table 4. Summary of Osprey Serialized Component Audit Findings as of January 31, 2025 52
Table 5. Reported Marine Corps and Navy Osprey Class A through D Accidents, Year of Initial Operational Capability Through Fiscal Year 2024 66
Table 6. Reported Air Force Osprey Class A through D Accidents, Year of Initial Operational Capability Through Fiscal Year 2024 68
Table 7. Reported Marine Corps and Navy Osprey Class A and B Accident Rates, Fiscal Years 2015-2024 69
Table 8. Reported Air Force Osprey Class A and B Accident Rates, Fiscal Years 2015-2024 70
Table 9. Reported Marine Corps Osprey and Department of the Navy Rotary Wing and Fixed Wing Fleet Annual Combined Class A and B Accident Rates, Fiscal Years 2015-2024 71
Table 10. Reported Air Force Osprey and Department of the Air Force Rotary Wing and Fixed Wing Fleet Annual Combined Class A and B Accident Rates, Fiscal Years 2015-2024 72
Table 11. Reported Marine Corps Osprey and Selected Department of the Navy Individual Aircraft Class A and B Accident Rates, by Aircraft Type, Fiscal Years 2015-2024 75
Table 12. Reported Air Force Osprey and Department of the Air Force Individual Aircraft Class A and B Accident Rates, by Aircraft Type, Fiscal Years 2015-2023 77
Figures 5
Figure 1. V-22 Osprey Variants and Capabilities 11
Figure 2. Osprey Class A-D Accidents and Fatalities, Fiscal Years 2007-2024 14
Figure 3. Aviation Accident Rate Calculation 15
Figure 4. Osprey Class A Accidents and Partial and Fleet-Wide Groundings, Fiscal Years 2022-2024 16
Figure 5. Marine Corps Osprey Class A and B Accident Rates, Fiscal Years (FY) 2015-2024 19
Figure 6. Air Force Osprey Class A and B Accident Rates, Fiscal Years (FY) 2015-2024 20
Figure 7. Aircraft Accident Rate Comparisons, Fiscal Years 2015-2024 22
Figure 8. Reported Causal Factors by Category for Marine Corps and Air Force Osprey Class A and B Accidents, Fiscal Years 2015-2024 24
Figure 9. Marine Corps Osprey Reported Causal Factors for Class A and B Accidents, Fiscal Years 2015-2024 26
Figure 10. Air Force Osprey Reported Causal Factors for Class A and B Accidents, Fiscal Years 2015-2024 27
Figure 11. Summary of Osprey System Safety Risk Assessments as of June 2025 31
Figure 12. Marine Corps, Air Force, and Navy Osprey Aircrew Flying Hours and Recent Grounding Periods, Fiscal Years 2015-2024 35
Figure 13. Summary and Median Age of Unresolved Osprey System Safety Risk Assessments, by Assessment Type as of June 2025 38
Figure 14. Factors Affecting Osprey Program’s Ability to Resolve Safety Risks 40
Figure 15. Summary Examples of Unit Personnel Statements Regarding Access to Safety Information 46
Figure 16. Summary Examples of Unit Personnel Statements Regarding Sharing Aircraft Knowledge 49
*표시는 필수 입력사항입니다.
| 전화번호 |
|---|
| 기사명 | 저자명 | 페이지 | 원문 | 기사목차 |
|---|
| 번호 | 발행일자 | 권호명 | 제본정보 | 자료실 | 원문 | 신청 페이지 |
|---|
도서위치안내: / 서가번호:

우편복사 목록담기를 완료하였습니다.
*표시는 필수 입력사항입니다.
저장 되었습니다.
