
 대표어
대표어
 https://www.accc.gov.au/about-us/publications/serial-publications/inquiry-into-the-national-electricity-market-2018-26-reports/inquiry-into-the-national-electricity-market-report-december-2025
권호기사보기
| 기사명 | 저자명 | 페이지 | 원문 | 기사목차 |
|---|
결과 내 검색
동의어 포함
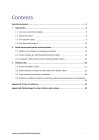
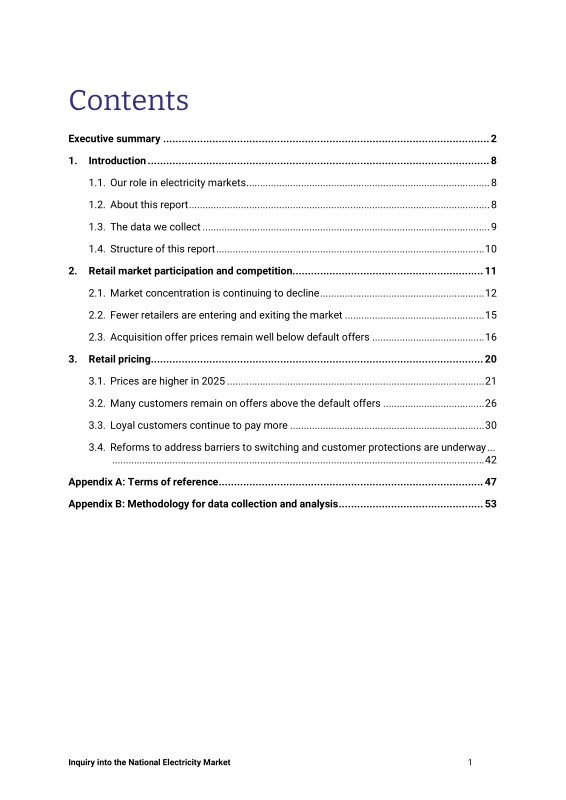
Title page 1
Contents 3
Acknowledgment of country 2
Executive summary 4
1. Introduction 10
1.1. Our role in electricity markets 10
1.2. About this report 10
1.3. The data we collect 11
1.3.1. The geographic scope of our analysis 11
1.4. Structure of this report 12
2. Retail market participation and competition 13
2.1. Market concentration is continuing to decline 14
2.2. Fewer retailers are entering and exiting the market 17
2.3. Acquisition offer prices remain well below default offers 18
2.3.1. Acquisition offer prices remain below default offers 19
2.3.2. The number of acquisition offers by smaller retailers has declined in 2025 21
3. Retail pricing 22
3.1. Prices are higher in 2025 23
3.1.1. Prices increased in all regions 24
3.1.2. Demand plans have similar or higher average prices than other plan types 26
3.1.3. More customers are on time of use plans 27
3.2. Many customers remain on offers above the default offers 28
3.2.1. Many customers are still paying prices at or above the default offers 28
3.2.2. Calculated annual prices for non-big 3 retailers are more dispersed than big 3 retailers 31
3.2.3. More customers are on complex plans 31
3.3. Loyal customers continue to pay more 32
3.3.1. Customers on older plans are still paying more 32
3.3.2. Loyalty penalties generally increase with plan age 34
3.3.3. Retailers are maintaining many legacy plans, supporting segmentation of their customer bases 36
3.3.4. Consumers are offered many plans when seeking to switch 37
3.3.5. Customers could achieve significant savings by switching to their retailer's better offer 38
3.3.6. More customers are on their retailer's best offer 40
3.3.7. Some customers switch regularly and more customers are on newer plans in 2025 42
3.4. Reforms to address barriers to switching and customer protections are underway 44
3.4.1. Existing consumer safeguards aid customer engagement and provide protections in the market 45
3.4.2. Reforms are underway to improve switching and better protect consumers, with opportunities to go further 46
Appendix A: Terms of reference 49
Part 1. Preliminary 51
1. Name 51
2. Commencement 51
3. Authority 51
4. Definitions 51
Part 2. Price inquiry into electricity 53
5. Commission to hold an inquiry 53
6. Directions on matters to be taken into consideration in the inquiry 53
7. Directions as to holding the inquiry 53
8. Period for completing the inquiry 54
Appendix B: Methodology for data collection and analysis 55
Tables 23
Table 3.1. Calculated annual prices for residential customers increased in 2025 23
Table 3.2. Calculated annual price changes were broadly consistent with price changes under the default offers 26
Table 3.3. Residential customers could save an average of nearly $300 by switching to their retailer's better offer 39
Figures 15
Figure 2.1. Market concentration declined slightly in 2024-25 15
Figure 2.2. The big 3 retailers lost market share in 2025 in most regions 16
Figure 2.3. For the first time since 2020, no retailers exited the market in 2025 17
Figure 2.4. The number of active retailers recovered slightly in 2024-25 18
Figure 2.5. Acquisition offer prices are well below the price cap of standing offers 20
Figure 2.6. The number of acquisition offers has decreased in 2025, especially from non-big 3 retailers 21
Figure 3.1. Calculated annual prices for residential customers increased in all regions, rising most in New South Wales 25
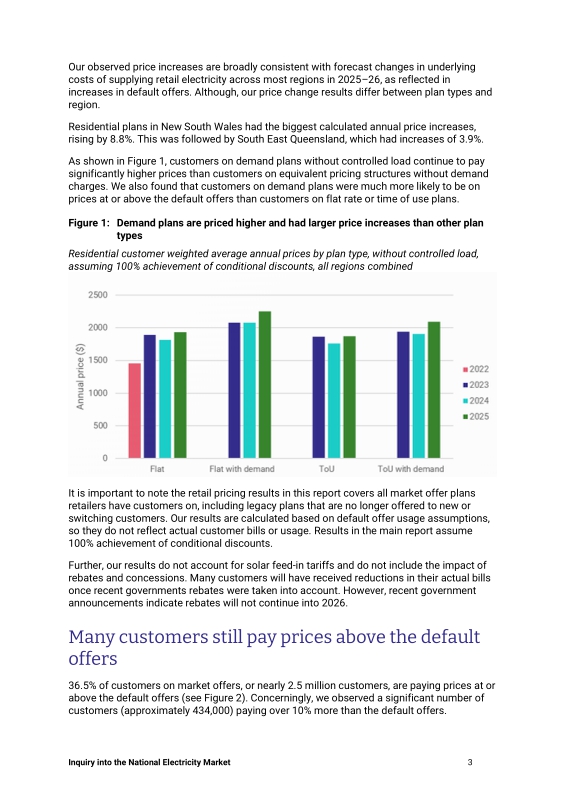
Figure 3.2. Among plans without a controlled load, demand plans are priced the highest and had the largest price increases 27
Figure 3.3. A substantial proportion of customers remain on prices above the default offers 29
Figure 3.4. Customers on demand plans are more likely to pay prices above the default offers than those not on demand plans 30
Figure 3.5. Big 3 retailers have a greater proportion of customers on prices at or above the default offers than non-big 3 retailers 31
Figure 3.6. The number of customers on complex plans has risen significantly from 2024 32
Figure 3.7. Customers on older plans pay more 33
Figure 3.8. Calculated annual prices increase with the age of the plan 34
Figure 3.9. Customers on older plans increasingly pay more 35
Figure 3.10. A large number of plans are maintained by retailers 36
Figure 3.11. Customers with different characteristics will be offered different numbers of plans in government comparison websites 38
Figure 3.12. Large savings are available to customers who switch to their retailer's better offer 39
Figure 3.13. More customers are on their retailer's best offer 40
Figure 3.14. The proportion of customers already on their retailer's better offer varies significantly from retailer to retailer 42
Figure 3.15. Customer switching rates respond to market events and price changes 43
Figure 3.16. The proportion of customers on newer plans has increased in 2025 44
Boxes 24
Box 3.1. Understanding common pricing elements 24
Appendix Tables 58
Table B.1. Default Market Offer and Victorian Default Offer usage assumptions 58
Table B.2. Default Market Offer and Victorian Default Offer usage assumptions 59
*표시는 필수 입력사항입니다.
| 전화번호 |
|---|
| 기사명 | 저자명 | 페이지 | 원문 | 기사목차 |
|---|
| 번호 | 발행일자 | 권호명 | 제본정보 | 자료실 | 원문 | 신청 페이지 |
|---|
도서위치안내: / 서가번호:

우편복사 목록담기를 완료하였습니다.
*표시는 필수 입력사항입니다.
저장 되었습니다.
