
 대표어
대표어
 https://www.iisd.org/publications/report/india-budgeting-for-net-zero-fdre


권호기사보기
| 기사명 | 저자명 | 페이지 | 원문 | 기사목차 |
|---|
결과 내 검색
동의어 포함
Title page 1
Contents 9
Acknowledgements 3
Executive Summary 4
1.0. Introduction 14
2.0. Context 15
2.1. Early Experiments Before FDRE in India (2019-2023) 17
2.2. The Shift Toward Storage 18
2.3. Overview of the FDRE Tendering Landscape 20
2.4. Impediments to Scaling FDRE 22
2.4.1. High Costs Associated With DFR Thresholds 22
2.4.2. Surplus Generation and Market Exposure 22
2.4.3. Land, Supply Chain, Infrastructure, and Regulatory Barriers 23
2.4.4. Financial and Institutional Constraints With Discoms 23
3.0. Approach and Methodology 25
3.1. Quantitative Analysis 27
3.1.1. Selection of Wind-Solar-Storage Combinations for FDRE 28
3.1.2. Annual Generation 30
3.1.3. LCOE Estimate of Solar, Onshore Wind, and Battery Storage 33
3.1.4. Benchmarking Effective FDRE LCOE Against TPPs 33
3.1.5. Adoption Trajectory of FDRE 34
3.2. Cost Gap 35
3.3. Externalities of Coal-Based Thermal Power 35
3.4. Macroeconomic Impacts 35
3.5. Qualitative Analysis 37
4.0. Results 38
4.1. Effective LCOE for FDRE 38
4.2. Estimating the Cost Gap for FDRE 39
4.3. Externalities 41
4.4. Macroeconomic Results 45
5.0. Discussion 50
5.1. Alternative Procurement and Financial Support Pathways for Firmed Renewable Energy 52
5.1.1. Contracts for Difference 52
5.1.2. Australia's Capacity Investment Scheme 54
5.1.3. PJM Interconnection and IESO Procurement Models 54
5.1.4. Lessons for FDRE 55
5.2. Overcoming Other Barriers to the Competitiveness of Firmed Renewables 55
6.0. Recommendations 57
References 58
Appendix A. Compilation of FDRE Tenders in India 69
Appendix B. Assumptions for Onshore Wind Levelized Cost of Electricity Estimation 71
Appendix C. Estimating Externalities of Thermal (Coal) Power 73
Appendix D. Methodology for Estimating Jobs From Firm and Dispatchable Renewable Energy 78
Tables 10
Table 1. Combinations of wind, solar, and storage considered to estimate effective LCOE for FDRE 29
Table 2. Estimated externalities associated with coal combustion in India 42
Table 3. Employment creation from FDRE generation and losses from coal substitution 48
Figures 10
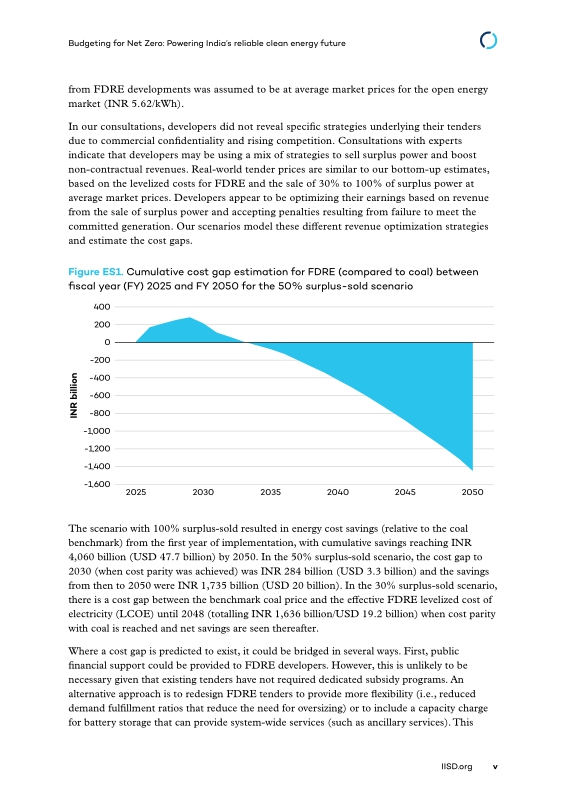
Figure ES1. Cumulative cost gap estimation for FDRE (compared to coal) between fiscal year (FY) 2025 and FY 2050 for the 50% surplus-sold scenario 5
Figure ES2. Cost-competitiveness of FDRE and coal power after accounting for the costs of externalities 6
Figure 1. Timeline and status of FDRE tenders awarded by central agencies 21
Figure 2. Present status of FDRE tenders for different FDRE configurations 21
Figure 3. Summary of research methodology 25
Figure 4. Conceptual approach to cost gap analysis 27
Figure 5. Scenario-wise revenue realization based on committed generation and the sale of surplus power in the open market 31
Figure 6. Methodology to estimate effective LCOE values for FDRE 32
Figure 7. FDRE adoption trajectory 34
Figure 8. Causal loop diagram on the systemic approach for macroeconomic analysis 36
Figure 9. Typical effective LCOE estimated in case 1: 30% surplus-sold and 100% surplus-sold scenarios 38
Figure 10. Validating simulated effective LCOEs for FDRE with several recently finalized bid-based LCOE values 39
Figure 11. Cost gap estimation for 100%, 50% and 30% surplus sold scenarios 40
Figure 12. The year of grid parity for FDRE depends on the share of excess generation from FDRE that could be sold in the open electricity market 40
Figure 13. Impact of the FDRE benchmark/LCOE crossover on the cumulative cost gap 41
Figure 14. Cost competitiveness of FDRE vs. coal (after factoring in externalities cost associated with thermal power generation) 43
Figure 15. Impact of FDRE adoption on the energy bill, average 2025-2050 46
Figure 16. Required FDRE support, as a share of the public budget 46
Figure 17. Required FDRE public support, as a share of GDP 47
Boxes 11
Box 1. Why is India experimenting with FDRE tenders? 16
Box 2. Demand fulfilment ratio 18
Box 3. Balancing firmness with viability: Penalties and incentives for FDRE 19
Box 4. Valuing the full range of capacity and flexibility services that battery storage can provide 24
Box 5. Government support measures for solar PV, BESS, and onshore wind 26
Box 6. FGD retrofitting costs, exemptions, and the FDRE advantage 44
Box 7. Timelines for commissioning new coal pithead plants and FDRE 44
Box 8. Solar-plus-BESS and FDRE: Complementary pathways 51
Equations 11
Equation 1. Estimating cost gap 28
Equation 2. Estimating annual solar power generation 32
Equation 3. Estimating annual wind power generation 32
Equation 4. Estimating annual storage requirement 32
Equation 5. Estimating the total cost of the FDRE system 32
Equation 6. Estimating the total generation 32
Equation 7. Estimating the additional revenue from selling surplus electricity in the open market 33
Equation 8. Effective LCOE of FDRE 33
Equation 9. Estimating the cost gap 35
Appendix Tables 10
Table A1. FDRE tenders issued between FY 2023-FY 2025 69
Table B1. Assumptions used in our onshore wind LCOE estimation 71
Table C1. Social cost of externalities 76
Table D1. Job coefficients for solar, wind, and battery storage technologies 78
*표시는 필수 입력사항입니다.
| 전화번호 |
|---|
| 기사명 | 저자명 | 페이지 | 원문 | 기사목차 |
|---|
| 번호 | 발행일자 | 권호명 | 제본정보 | 자료실 | 원문 | 신청 페이지 |
|---|
도서위치안내: / 서가번호:

우편복사 목록담기를 완료하였습니다.
*표시는 필수 입력사항입니다.
저장 되었습니다.
