대표어
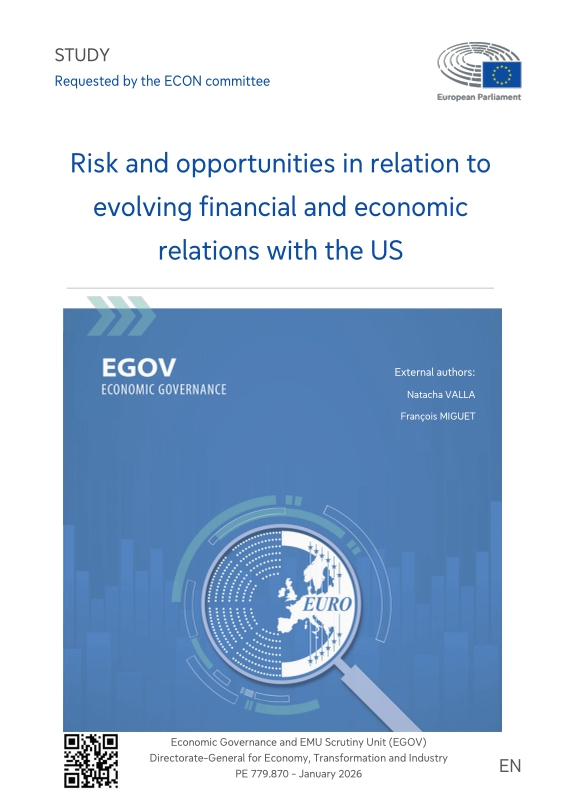
 https://op.europa.eu/en/publication-detail/-/publication/924eb931-ec40-11f0-8d3c-01aa75ed71a1/language-en?WT.mc_id=Selectedpublications&WT.ria_c=41957&WT.ria_f=6415&WT.ria_ev=search


권호기사보기
| 기사명 | 저자명 | 페이지 | 원문 | 기사목차 |
|---|
결과 내 검색
동의어 포함
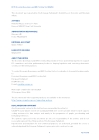
Title page 1
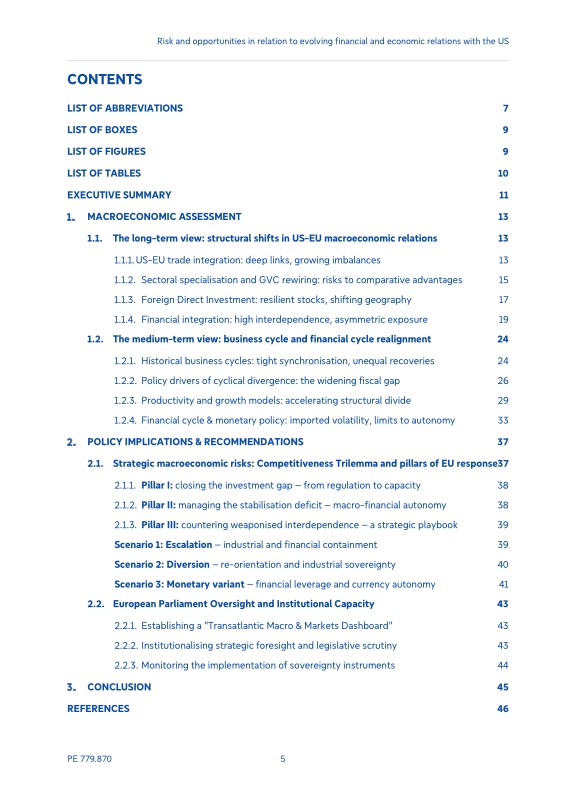
Contents 5
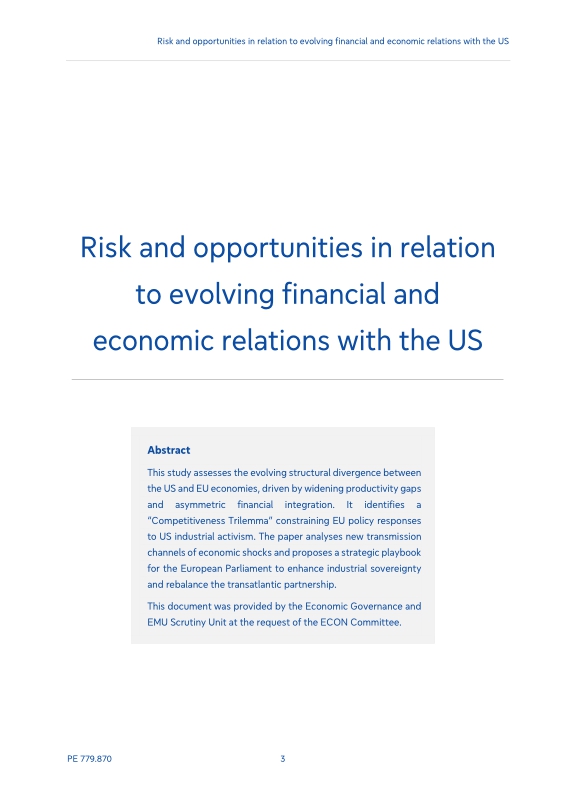
ABSTRACT 3
LIST OF ABBREVIATIONS 7
EXECUTIVE SUMMARY 11
1. MACROECONOMIC ASSESSMENT 13
1.1. The long-term view: structural shifts in US-EU macroeconomic relations 13
1.1.1. US-EU trade integration: deep links, growing imbalances 13
1.1.2. Sectoral specialisation and GVC rewiring: risks to comparative advantages 15
1.1.3. Foreign Direct Investment: resilient stocks, shifting geography 17
1.1.4. Financial integration: high interdependence, asymmetric exposure 19
1.2. The medium-term view: business cycle and financial cycle realignment 24
1.2.1. Historical business cycles: tight synchronisation, unequal recoveries 24
1.2.2. Policy drivers of cyclical divergence: the widening fiscal gap 26
1.2.3. Productivity and growth models: accelerating structural divide 29
1.2.4. Financial cycle & monetary policy: imported volatility, limits to autonomy 33
2. POLICY IMPLICATIONS & RECOMMENDATIONS 37
2.1. Strategic macroeconomic risks: Competitiveness Trilemma and pillars of EU response 37
2.1.1. Pillar I: closing the investment gap - from regulation to capacity 38
2.1.2. Pillar II: managing the stabilisation deficit - macro-financial autonomy 38
2.1.3. Pillar III: countering weaponised interdependence - a strategic playbook 39
Scenario 1: Escalation - industrial and financial containment 39
Scenario 2: Diversion - re-orientation and industrial sovereignty 40
Scenario 3: Monetary variant - financial leverage and currency autonomy 41
2.2. European Parliament Oversight and Institutional Capacity 43
2.2.1. Establishing a "Transatlantic Macro & Markets Dashboard" 43
2.2.2. Institutionalising strategic foresight and legislative scrutiny 43
2.2.3. Monitoring the implementation of sovereignty instruments 44
3. CONCLUSION 45
REFERENCES 46
ANNEX 49
A.1. Cyclicality analysis 49
A.2. Revealed Comparative Advantage (RCA) analysis 56
A.3. Monetary policy synchronisation analysis 59
A.4. Additional figures 61
Tables 10
Table 1. US-EU structural divergence in sectoral composition, by GVA and employment (2019-2023) 32
Table 2. Decomposition of GVA Growth by factor contribution: US vs EU (2019-2023) 32
Table 3. Overview of strategic responses: a potential EU playbook 42
Figures 9
Figure 1. US-EU trade balance: gross flows and net balances (2005-2023) 14
Figure 2. Regional composition of US and EU trade (2000-2024) 15
Figure 3. Sectoral decomposition of US-EU trade balance: goods and services (2023) 16
Figure 4. Financial integration across the Atlantic: FDI stocks as share of GDP (2009-2023) 17
Figure 5. Regional composition of US and EU FDI (2009-2023) 18
Figure 6. US-EU gross and net financial portfolio positions (2009-2023) 20
Figure 7. Regional composition of US and EU international financial portfolios (2001-2023) 20
Figure 8. Typology and composition of transatlantic portfolio holders (2024) 21
Figure 9. Holdings & risk preference: debt vs equity holdings by sector (2024) 23
Figure 10. Breakdown of US and EA public debt holders, by nationality 23
Figure 11. Supply-side and demand-side growth decomposition analysis (2021-2025) 24
Figure 12. Diverging Growth Trajectories: Revisions in output gaps and real GDP (2018-2028) 25
Figure 13. Manufacturing and energy price dynamics in the US and EU (2018-2025) 26
Figure 14. Diverging Fiscal Trajectories: Revisions in public debt and structural balances (2018-2028) 27
Figure 15. The growing US-EU productivity divide (2014-2024) 29
Figure 16. US-EU contrasted demographics and labour market dynamics (2008-2025) 30
Figure 17. Fed-ECB policy rates and divergence analysis (1999-2025) 34
Figure 18. The EU Competitiveness Trilemma as an Impossible Triangle 37
Boxes 9
Box 1. Stablecoins and the durability of the dollar dominance amid fragmentation 22
Box 2. The digital productivity divide: how AI asymmetry reshapes transatlantic economic relations 33
Box 3. A euro-area "safe asset": macro-financial, strategic and institutional considerations 36
Annex Figures 9
Figure A.1. Cyclicality Analysis: real economic variables (2000-2025) 51
Figure A.2. Cyclicality analysis: structural variables & prices (2000-2025) 52
Figure A.3. Cyclicality analysis: interest rates & exchange rates variables (2000-2025) 53
Figure A.4. Cyclicality analysis: financial variables (2000-2025) 54
Figure A.5. Cyclicality Analysis: risk & uncertainty (2000-2025) 55
Figure A.6. US-EU comparative advantage by sector: changes from 2012 to 2023 57
Figure A.7. Asymmetry analysis in Fed-ECB monetary policy synchronicity and spillovers 59
Figure A.8. US-EU trade balance in goods and services as % of GDP 61
Figure A.9. Fiscal indicators across EU countries (2011-2027) 61
Figure A.10. EA countries 10Y sovereign spreads heterogeneity (2007-2025) 62
*표시는 필수 입력사항입니다.
| 전화번호 |
|---|
| 기사명 | 저자명 | 페이지 | 원문 | 기사목차 |
|---|
| 번호 | 발행일자 | 권호명 | 제본정보 | 자료실 | 원문 | 신청 페이지 |
|---|
도서위치안내: / 서가번호:

우편복사 목록담기를 완료하였습니다.
*표시는 필수 입력사항입니다.
저장 되었습니다.