
 대표어
대표어
 https://www.accc.gov.au/about-us/publications/serial-publications/gas-inquiry-2017-30-reports/gas-inquiry-december-2025-interim-report
권호기사보기
| 기사명 | 저자명 | 페이지 | 원문 | 기사목차 |
|---|
결과 내 검색
동의어 포함
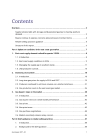
Title page 1
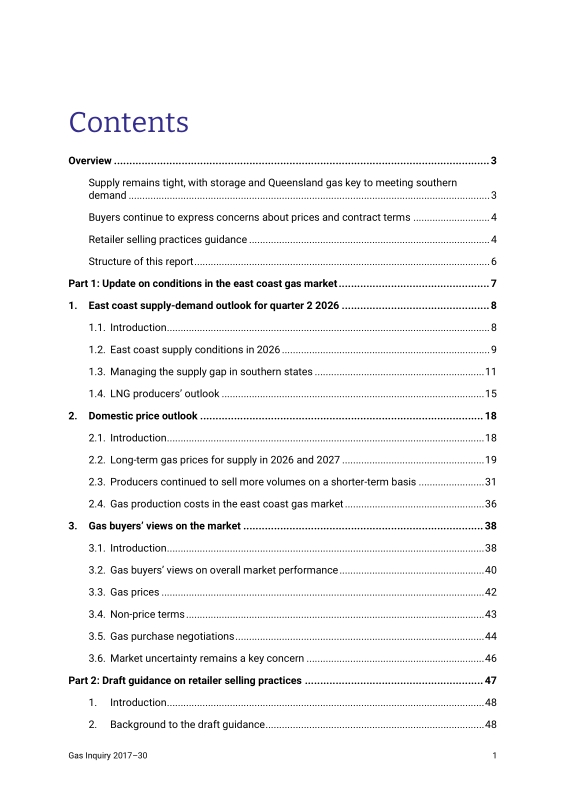
Contents 3
Acknowledgment of country 2
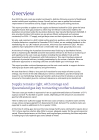
Overview 5
Supply remains tight, with storage and Queensland gas key to meeting southern demand 5
Domestic prices are within expected ranges, with gas increasingly sold on a short-term basis 6
Buyers continue to express concerns about prices and contract terms 6
Retailer selling practices guidance 6
LNG netback price series review 7
Report on gas production costs 7
Structure of this report 8
Part 1: Update on conditions in the east coast gas market 9
1. East coast supply-demand outlook for quarter 2 2026 10
1.1. Introduction 10
1.2. East coast supply conditions in 2026 11
1.3. Managing the supply gap in southern states 13
1.4. LNG producers' outlook 17
2. Domestic price outlook 20
2.1. Introduction 20
2.2. Long-term gas prices for supply in 2026 and 2027 21
2.3. Producers continued to sell more volumes on a shorter-term basis 33
2.4. Gas production costs in the east coast gas market 38
3. Gas buyers' views on the market 40
3.1. Introduction 40
3.2. Gas buyers' views on overall market performance 42
3.3. Gas prices 44
3.4. Non-price terms 45
3.5. Gas purchase negotiations 46
3.6. Market uncertainty remains a key concern 48
Part 2: Draft guidance on retailer selling practices 49
1. Introduction 50
2. Background to the draft guidance 50
3. Purpose of guidance 53
4. Proposed scope and application of the guidance 53
5. Proposed draft guidance 54
5.1. Introduction to the guidance 56
5.2. Retailers and buyers should act in good faith 56
5.3. Offer processes 57
5.4. Risk allocation 58
5.5. Sale of spot market linked products 60
5.6. Transparency 61
6. Consultation process and next steps 62
6.1. Anticipated timeline 62
6.2. How to participate 62
6.3. Treatment of confidential information 62
Part 3: LNG netback price series review 64
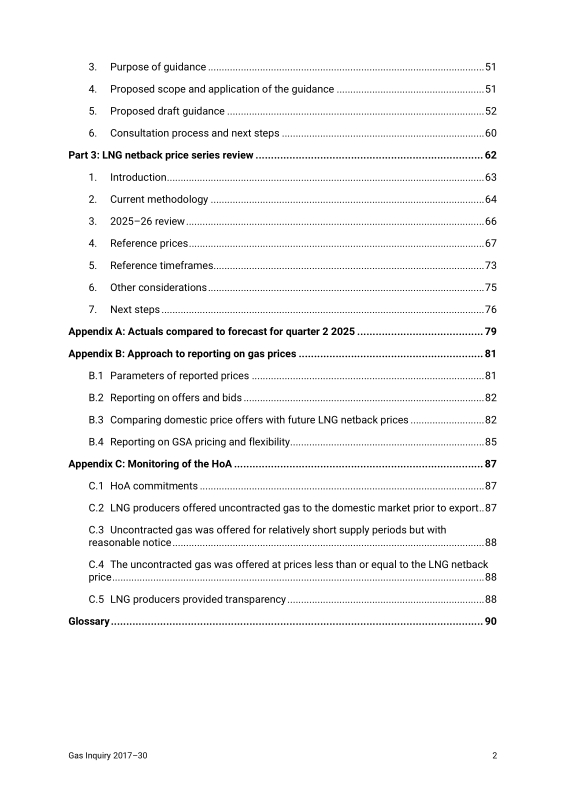
1. Introduction 65
2. Current methodology 66
3. 2025-26 review 68
4. Reference prices 69
5. Reference timeframes 75
6. Other considerations 77
7. Next steps 78
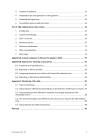
Appendix A: Actuals compared to forecast for quarter 2 2025 81
Appendix B: Approach to reporting on gas prices 83
B.1. Parameters of reported prices 83
B.2. Reporting on offers and bids 84
B.3. Comparing domestic price offers with future LNG netback prices 84
B.4. Reporting on GSA pricing and flexibility 87
Appendix C: Monitoring of the HoA 89
C.1. HoA commitments 89
C.2. LNG producers offered uncontracted gas to the domestic market prior to export 89
C.3. Uncontracted gas was offered for relatively short supply periods but with reasonable notice 90
C.4. The uncontracted gas was offered at prices less than or equal to the LNG netback price 90
C.5. LNG producers provided transparency 90
Glossary 92
Tables 18
Part 1: Update on conditions in the east coast gas market 18
Table 1.1. LNG producers' forecast supply and contracted sales in quarter 2 2026 (PJ) 18
Table 2.1. GSAs by pricing mechanisms between July 2025 and September 2025 for 2026 and 2027 supply 26
Table 2.2. Number of long-term GSAs for supply in 2026 and 2027 32
Part 2: Draft guidance on retailer selling practices 52
Table 1. ACCC expectations and assessment of retailer standard selling practices in December 2024 52
Table 2. Anticipated timeline 62
Figures 42
Part 1: Update on conditions in the east coast gas market 42
Figure 3.1. Industries represented in ACCC user engagement program 42
Part 2: Draft guidance on retailer selling practices 59
Figure 1. Illustration of alternate take or pay approach 59
Part 3: LNG netback price series review 66
Figure 1. Stylised example of how LNG prices are netted back 66
Charts 12
Part 1: Update on conditions in the east coast gas market 12
Chart 1.1. Quarterly supply-demand balance for the east coast in 2026 (PJ) 12
Chart 1.2. Breakdown of changes in supply-demand forecasts for quarter 2 2026 13
Chart 1.3. Quarterly supply-demand outlook for southern states (PJ) 14
Chart 1.4. Southern states supply-demand balance in quarter 2 (2022-2026) 15
Chart 1.5. Year-on-year Iona underground storage levels (2021-2025) 16
Chart 1.6. GPG demand forecast vs actual for southern states (2024-2026) 17
Chart 2.1. Gas commodity prices (2026$/GJ) offered in the east coast for 2026 supply 22
Chart 2.2. Gas commodity prices agreed in the east coast gas market for 2026 supply 23
Chart 2.3. Gas commodity prices (2027$/GJ) offered in the east coast for 2027 supply 24
Chart 2.4. Gas commodity prices agreed in the east coast gas market for 2027 supply 25
Chart 2.5. GSA take-or-pay and load factor flexibility, supply years 2026 and 2027 27
Chart 2.6. Gas commodity prices (2026$/GJ) offered to the southern states for 2026 supply against short-term LNG netback expectations 28
Chart 2.7. Gas commodity prices (2026$/GJ) offered for 2026 supply to the southern states against expectations of medium-term oil-linked LNG netback 29
Chart 2.8. Gas commodity prices agreed in the southern states and Queensland 30
Chart 2.9. Gas prices (2026$/GJ) offered by producers for Queensland 2026 supply against expectations of short-term LNG netback and medium-term oil-linked LNG netback 31
Chart 2.10. Cumulative volumes contracted under long-term GSAs for supply years 2021-2027 33
Chart 2.11. Gas volumes (PJ) sold by LNG and Non-LNG producers under short -term GSAs from Q1 2023 to Q2 2025 34
Chart 2.12. Gas volumes (PJ) sold under short-term GSAs with term length details from Q1 2023 to Q2 2025 35
Chart 2.13. Gas volumes (PJ) sold under short-term GSAs with supply details from Q1 2023 to Q2 2025 36
Chart 2.14. Gas user contracted volumes (PJ), from January 2024 to June 2025 37
Chart 2.15. Comparative analysis between Long-term & Short-term GSAs from January 2023 to June 2025 38
Chart 3.1. Buyer sentiment of east coast gas market performance, as at September 2025 43
Chart 3.2. Perceptions of suppliers' performance in negotiations, as at September 2025 47
Part 3: LNG netback price series review 70
Chart 1/Chart 2. Destinations of Australian LNG exports 2020-2024 70
Chart 2/Chart 3. Correlation between JKM and TTF between 2015 and 2024 71
Chart 3/Chart 4. Henry Hub 'plus' pricing breakdown 73
Chart 4/Chart 5. Indexation of newly signed long-term contracts, weighted by MTPA 74
Chart 5/Chart 6. JKM liquidity 24 months out July 2020, July 2025 76
Boxes 41
Part 1: Update on conditions in the east coast gas market 41
Box 3.1. ACCC User Engagement Program 41
Part 2: Draft guidance on retailer selling practices 55
Box 1. Summary of questions for consultation 55
Box 2. Questions for consultation in relation to good faith 57
Box 3. Questions for consultation in relation to offer processes 58
Box 4. Examples 58
Box 5. Questions for consultation in relation to risk allocation 59
Box 6. Questions for consultation in relation to the sale of spot market linked products 60
Box 7. Questions for consultation in relation to transparency 61
Box 8. Making a claim of confidentiality 63
Part 3: LNG netback price series review 66
Box 1. 2021-22 review of the LNG netback price series 66
Box 2. Current reference prices and timeframes 67
Box 3. Incremental costs for LNG supply 67
Box 4. Formula for calculating LNG netback prices 67
Box 5. Summary of questions for consultation 69
Box 6. Questions for consultation in relation to reference prices 75
Box 7. Questions for consultation in relation to reference timeframes 77
Box 8. Questions for consultation in relation to other considerations 78
Box 9. Making a written submission 79
Box 10. Making a claim of confidentiality 79
Appendix Tables 81
Table A.1. Comparison of forecast vs actuals for Quarter 2 2025 81
*표시는 필수 입력사항입니다.
| 전화번호 |
|---|
| 기사명 | 저자명 | 페이지 | 원문 | 기사목차 |
|---|
| 번호 | 발행일자 | 권호명 | 제본정보 | 자료실 | 원문 | 신청 페이지 |
|---|
도서위치안내: / 서가번호:

우편복사 목록담기를 완료하였습니다.
*표시는 필수 입력사항입니다.
저장 되었습니다.
