
 대표어
대표어
 https://www.gao.gov/products/gao-26-108485
권호기사보기
| 기사명 | 저자명 | 페이지 | 원문 | 기사목차 |
|---|
결과 내 검색
동의어 포함
Title page 1
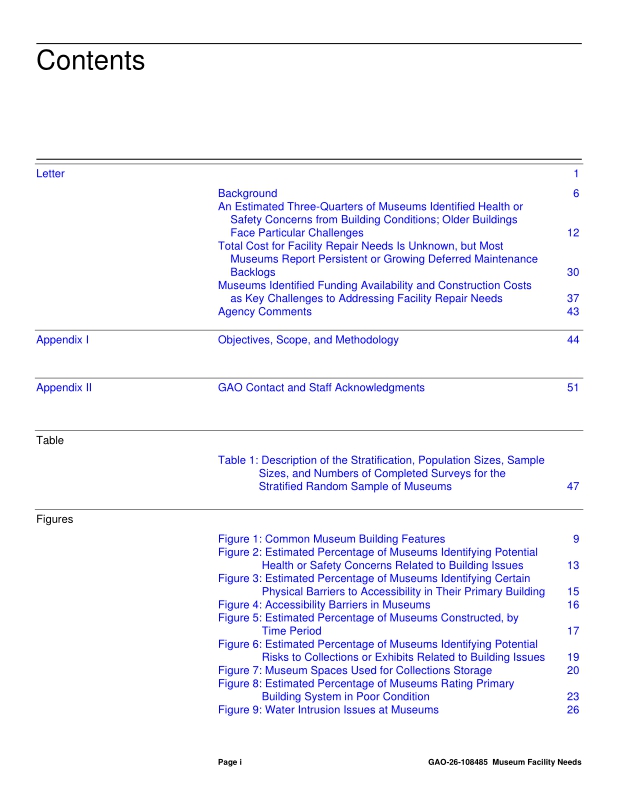
Contents 3
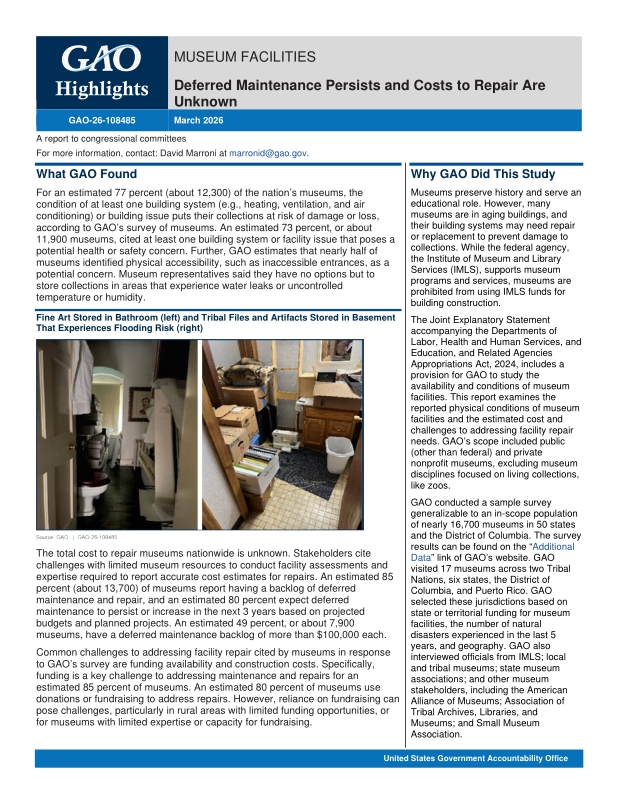
Highlights 2
Letter 6
Background 11
Museum Governance Structure 11
Characteristics of Museum Facilities 11
IMLS Roles and Other Federal Resources 15
An Estimated Three-Quarters of Museums Identified Health or Safety Concerns from Building Conditions; Older Buildings... 17
An Estimated 73 Percent of Museums Identified a Potential Health or Safety Concern, with 49 Percent Citing a Concern Related... 17
An Estimated 77 Percent of Museums Identified at Least One Building Issue That Puts Collections or Exhibits at Potential Risk 23
An Estimated 32 Percent of Museums Identified at Least One Building System in Poor Condition 27
Some Museums Report Facing Facility and Resiliency Challenges Related to Aging Buildings 32
Total Cost for Facility Repair Needs Is Unknown, but Most Museums Report Persistent or Growing Deferred Maintenance Backlogs 35
Absence of Data and Limitations in Resources and Staff Expertise Are Challenges to Estimating Nationwide Facility Repair Costs 35
An Estimated 85 Percent of Museums Report Having a Deferred Maintenance Backlog, and 38 Percent Report an Increasing... 36
Museums Identified Funding Availability and Construction Costs as Key Challenges to Addressing Facility Repair Needs 42
Agency Comments 48
Appendix I: Objectives, Scope, and Methodology 49
Appendix II: GAO Contact and Staff Acknowledgments 56
Tables 3
Table 1. Description of the Stratification, Population Sizes, Sample Sizes, and Numbers of Completed Surveys for the Stratified... 52
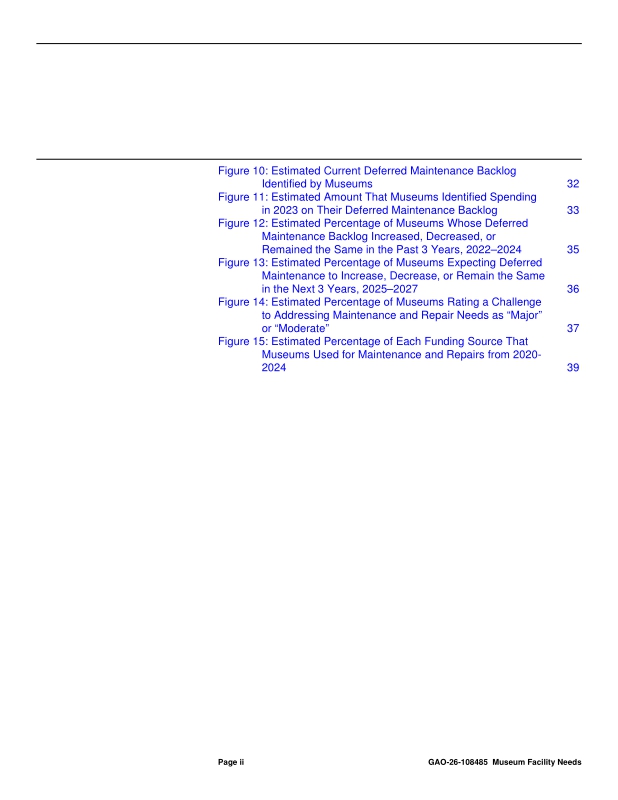
Figures 3
Figure 1. Common Museum Building Features 14
Figure 2. Estimated Percentage of Museums Identifying Potential Health or Safety Concerns Related to Building Issues 18
Figure 3. Estimated Percentage of Museums Identifying Certain Physical Barriers to Accessibility in Their Primary Building 20
Figure 4. Accessibility Barriers in Museums 21
Figure 5. Estimated Percentage of Museums Constructed, by Time Period 22
Figure 6. Estimated Percentage of Museums Identifying Potential Risks to Collections or Exhibits Related to Building Issues 24
Figure 7. Museum Spaces Used for Collections Storage 25
Figure 8. Estimated Percentage of Museums Rating Primary Building System in Poor Condition 28
Figure 9. Water Intrusion Issues at Museums 31
Figure 10. Estimated Current Deferred Maintenance Backlog Identified by Museums 37
Figure 11. Estimated Amount That Museums Identified Spending in 2023 on Their Deferred Maintenance Backlog 38
Figure 12. Estimated Percentage of Museums Whose Deferred Maintenance Backlog Increased, Decreased, or Remained... 40
Figure 13. Estimated Percentage of Museums Expecting Deferred Maintenance to Increase, Decrease, or Remain the Same... 41
Figure 14. Estimated Percentage of Museums Rating a Challenge to Addressing Maintenance and Repair Needs as "Major" or "Moderate" 42
Figure 15. Estimated Percentage of Each Funding Source That Museums Used for Maintenance and Repairs from 2020-2024 44
*표시는 필수 입력사항입니다.
| 전화번호 |
|---|
| 기사명 | 저자명 | 페이지 | 원문 | 기사목차 |
|---|
| 번호 | 발행일자 | 권호명 | 제본정보 | 자료실 | 원문 | 신청 페이지 |
|---|
도서위치안내: / 서가번호:

우편복사 목록담기를 완료하였습니다.
*표시는 필수 입력사항입니다.
저장 되었습니다.
